Data Service / Projection

This is the temperature and rainfall data for the next 86 years produced using the statistical downscaling method.
The production method is explained as follows:
The statistical downscaling methods for temperature and rainfall are both based on the AR5 statistical downscaling method, but some steps are added and the bias correction method is adjusted for rainfall.
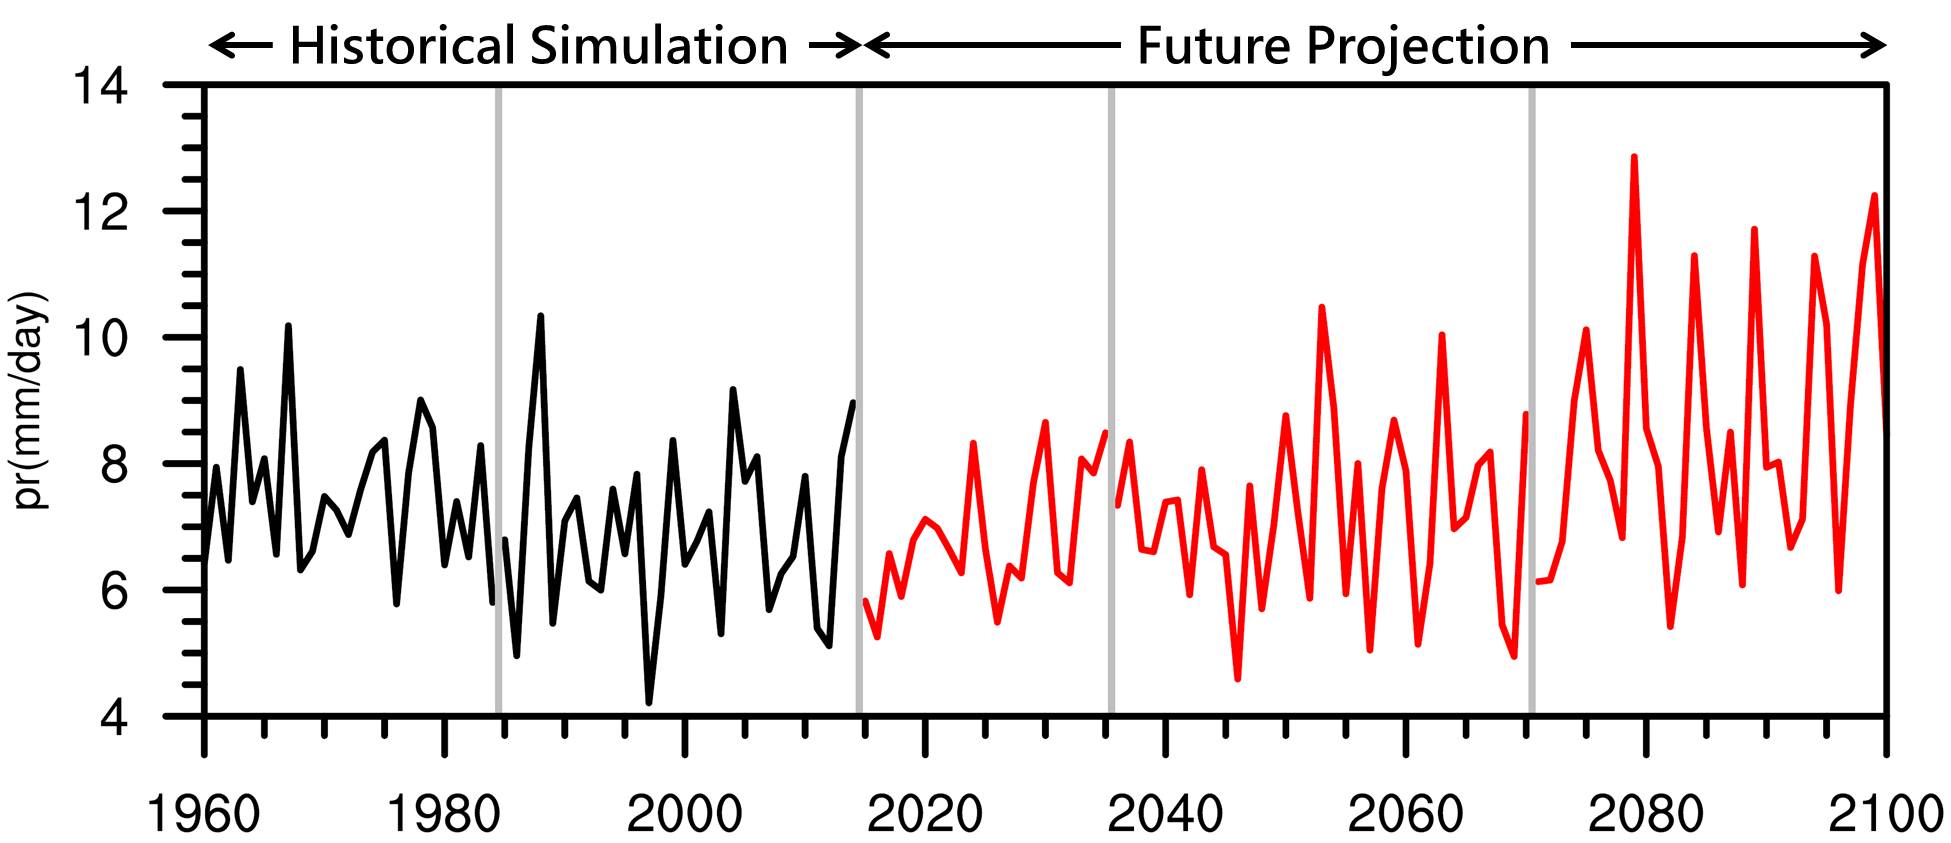
Whether it is historical simulation or future projection data, they are downscaled in segments (Figure 1), ensuring better consistency between the model and observation data in the baseline period, and the correction sample size of the baseline and projection data is also more similar.
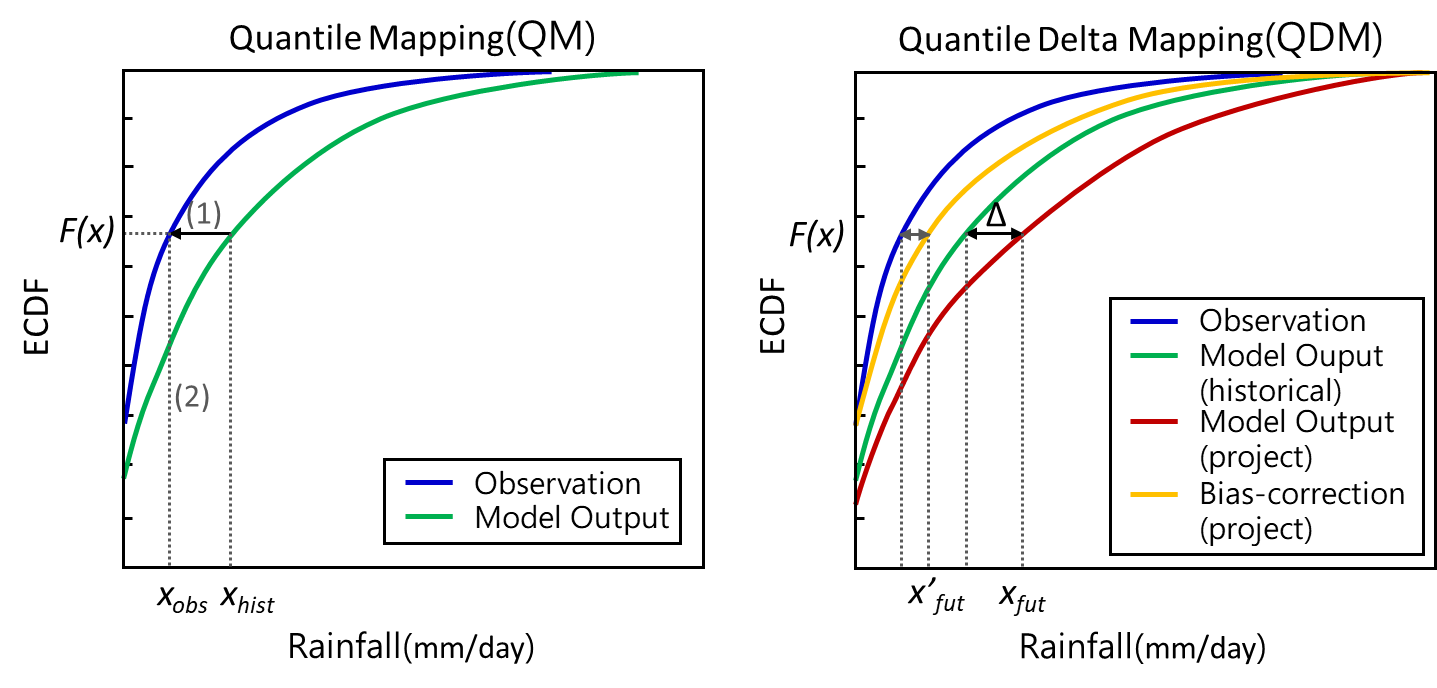
For historical simulation data, the concept of rainfall probability (the percentage of rainy days relative to the total days) is added, and by adjusting the model's rainfall threshold value, the historical simulation's rainfall probability is consistent with the observation data, and then the observation and model data are divided into two groups (rainy days, non-rainy days), and bias correction is performed separately. For future projection data, the baseline-adjusted rainfall threshold value is applied first, and the baseline and projection data are divided into two groups and corrected. The bias correction method uses quantile delta mapping (QDM, Cannon, 2015) instead of the previous version of quantile mapping (QM), which can reduce the phenomenon of excessive rainfall amplification caused by extrapolation of the cumulative distribution function (CDF), and better preserve the original projection changes of the model (Figure 2).