Data Service / Projection

This is the temperature and rainfall data for the next 100 years produced using the statistical downscaling method.
The production method is explained as follows:
In order to preserve the climate characteristics of the climate model in the region before downscaling, this method uses the empirical-statistical correction method developed by Gobiet et. al., 2015; Maurer, 2007; Wood et. al., 2002; 2004.
First, use the linear interpolation (Bilinear interpolation) method to convert both the high-resolution observation daily data and the climate model data to a grid resolution of 5 km.
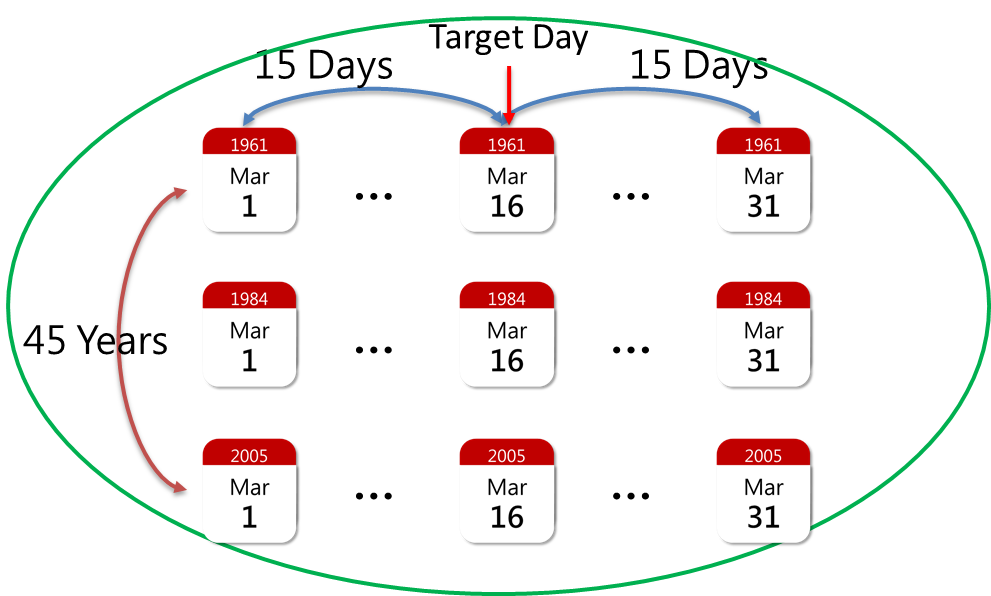
To preserve the extreme value signal of the daily data, the sampling method is to take the observation and model data daily, each year containing 31 calendar days before and after the target day, a total of 1395 days for 45 years as a sample (as shown in Figure 1), using the empirical cumulative probability ECDF (empirical cumulative density functions) function distribution, showing the statistical characteristics of the two sets of data. To correct the bias value of the model data, make the model simulation rainfall statistical distribution characteristics consistent with the observation, adjust the model's ECDF to the same as the observation's ECDF.
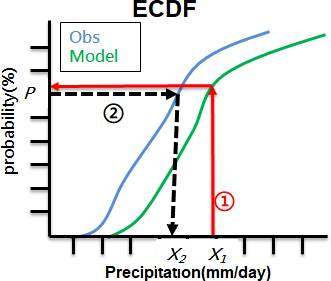
Taking the rainfall bias-correction in Figure 2 as an example, the model original rainfall amount X1, according to the path ① corresponding to the model probability density value P, with the same probability density value as the observation according to the path ②, get the corresponding rainfall amount X2 as the model bias-correction value.