Data Service / Atlas of Taiwan Climate Change Key Indices
Q1. How are the future scenarios set?
In the climate change projections conducted by the IPCC Working Group I, future scenarios are primarily based on human-induced emissions or concentrations of greenhouse gases, aerosols, and other climate drivers. The scenarios do not include changes in natural drivers such as solar radiation, volcanic activities, or natural emissions of methane and nitrous oxide. The focus is solely on anthropogenic emissions.
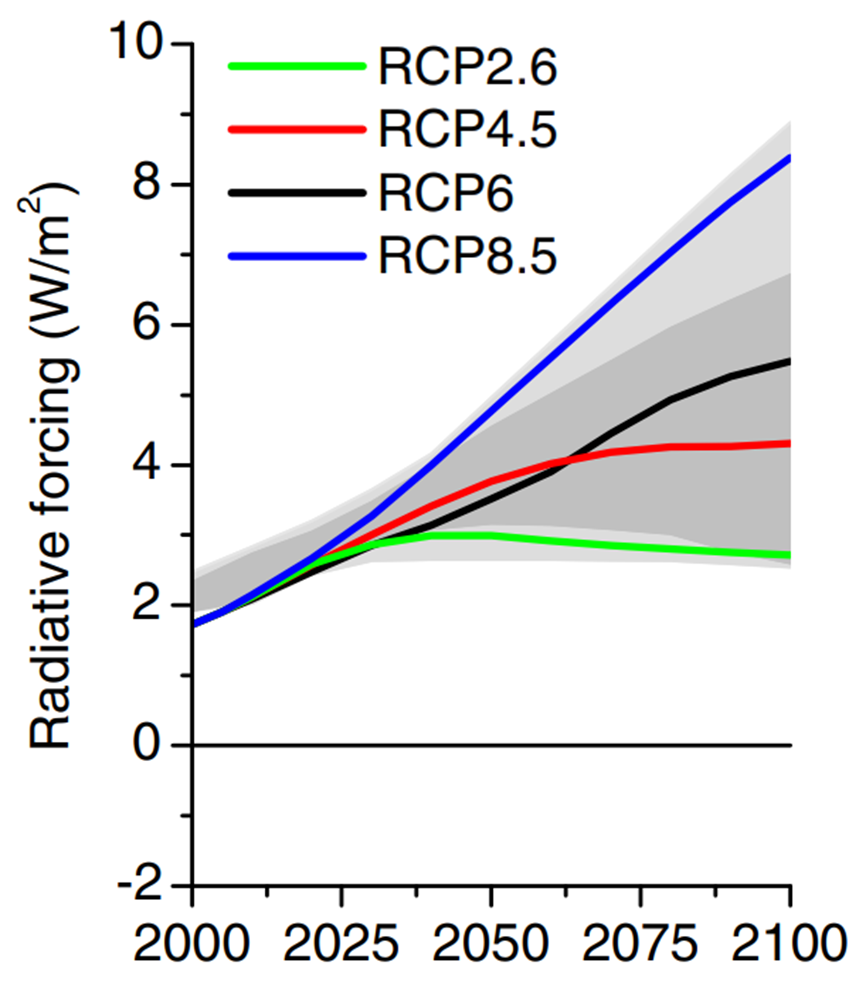
In the IPCC Fifth Assessment Report, four future scenarios were redefined using the "Representative Concentration Pathways" (RCPs), which represent the trajectories of concentration changes. These scenarios are differentiated based on the difference in radiative forcing between 2100 and 1750, measured in watts per square meter (W/m2). The scenarios are named as RCP2.6, RCP4.5, RCP6.0, and RCP8.5, indicating radiative forcing increases of 2.6, 4.5, 6.0, and 8.5 W/m2, respectively (refer to Figure 1)
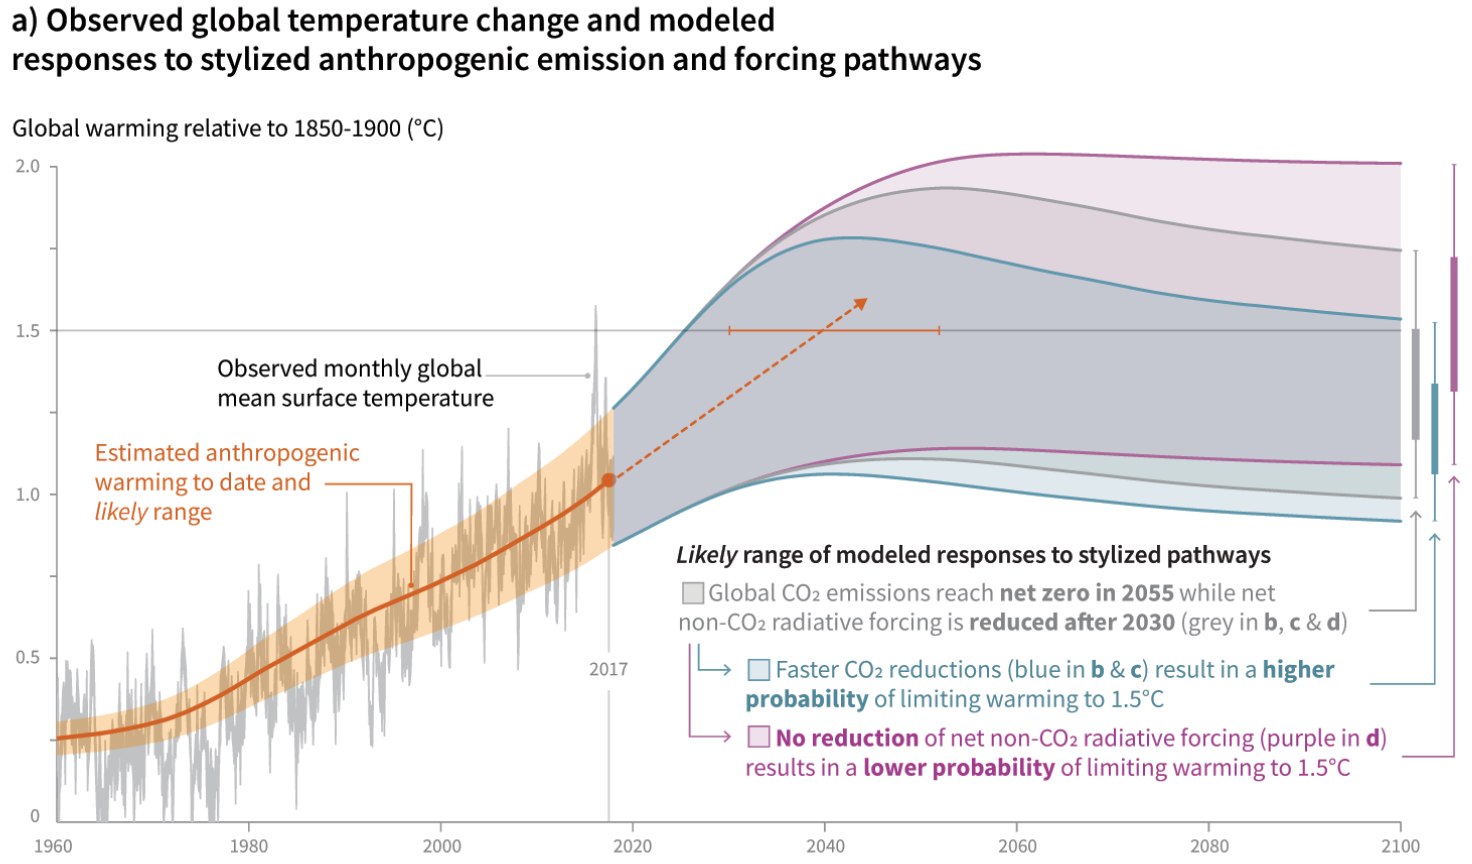
This atlas introduces additional warming scenarios: 1.5°C, 2°C, and 4°C. These scenarios are based on the IPCC's Special Report on Global Warming of 1.5°C, published in 2018. They correspond to the years when the 30-year running average of global average surface temperature first reached 1.5°C-4°C relative to the pre-industrial level (1850-1900). Climate periods of 30 years, centered around the specified year first reaching 1.5°C-4°C under different RCPs for individual models, were used in the atlas (refer to Figure 2). There are 98 ensemble members for the 1.5°C warming scenario, 83 ensemble members for the 2°C warming scenario, and 19 ensemble members for the 4°C warming scenario.