Data Service / Atlas of Taiwan Climate Change Key Indices
Atlas of Taiwan Climate Change Key Indices: AR6 Statistical Downscaling Edition
This atlas compiles climate change indices recommended by the Expert Team on Climate Change Detection and Indices (ETCCDI) of the World Meteorological Organization. It includes extreme indices such as extreme high temperatures, low temperatures, heavy rainfall, and drought, applied to climate change projection in Taiwan. Referring to the Intergovernmental Panel on Climate Change (IPCC) Sixth Assessment Report (AR6), the atlas utilizes the latest AR6 warming scenarios and climate projection data. It also introduces Global Warming Levels (GWLs) as alternative way to assess climate change, helping readers better understand the degree of climate change impacts in Taiwan when different global climate targets are implemented. The atlas incorporates uncertainty assessments of climate change signals, providing readers with a better understanding of the potential uncertainties associated with these projection information when applying the charts.
Data Sources
The data used in this atlas is sourced from the TCCIP project, including observational data and model data. The observational data comes from stations located throughout Taiwan, such as those operated by the Central Weather Administration. These data are processed and aggregated to create gridded observational data, with a temporal resolution of daily records and a spatial resolution of 0.05° x 0.05° for each grid. The model data is derived from global climate models used in the IPCC AR6, specifically from the Coupled Model Intercomparison Project Phase 6 (CMIP6), which includes climate simulation data from 31 models under four emission scenarios. The model output is also at a daily resolution. To obtain historical climate simulations and future projections applicable for Taiwan, a statistical downscaling method is applied to produce AR6 statistical downscaling data with the same spatial resolution as the observational data. For more information on "gridded observational daily data" and "AR6 statistical downscaling daily data," please refer to the "Data Service" section on the TCCIP website, which provides comprehensive descriptions in the "Data Introduction" and offers data downloads in the "Climate Change Data Store."
Scenario
The IPCC AR6 adopts a combination of "Shared Socioeconomic Pathways (SSPs)" and "Representative Concentration Pathways (RCPs)" as the scenario framework. The SSPs represent different socioeconomic development pathways, while the RCPs represent the radiative forcing outcomes resulting from greenhouse gas (GHG) emissions or concentration changes, collectively known as SSP emission scenarios (or SSP-RCPs). Due to the complexity of SSP emission scenarios and the substantial variation in temperature responses among different climate models under the same emission scenario, the IPCC has introduced GWLs as the primary approach to assess climate change caused by warming. This allows for better understanding and comparison of the climate changes in Taiwan or other regions under different global average temperature increases, such as the commonly discussed 1.5°C and 2°C global warming levels.
- SSP Emission Scenarios: The scenarios are characterized by different assumptions regarding future socioeconomic conditions, emission reductions, aerosol pollution, and other factors influencing GHG emissions. They can be simplistically classified into four representative scenarios based on the level of GHG emissions, ranging from low to very high: SSP1-2.6 (low emissions), SSP2-4.5 (medium emissions), SSP3-7.0 (high emissions), and SSP5-8.5 (very high emissions). (See Table 1 for details)
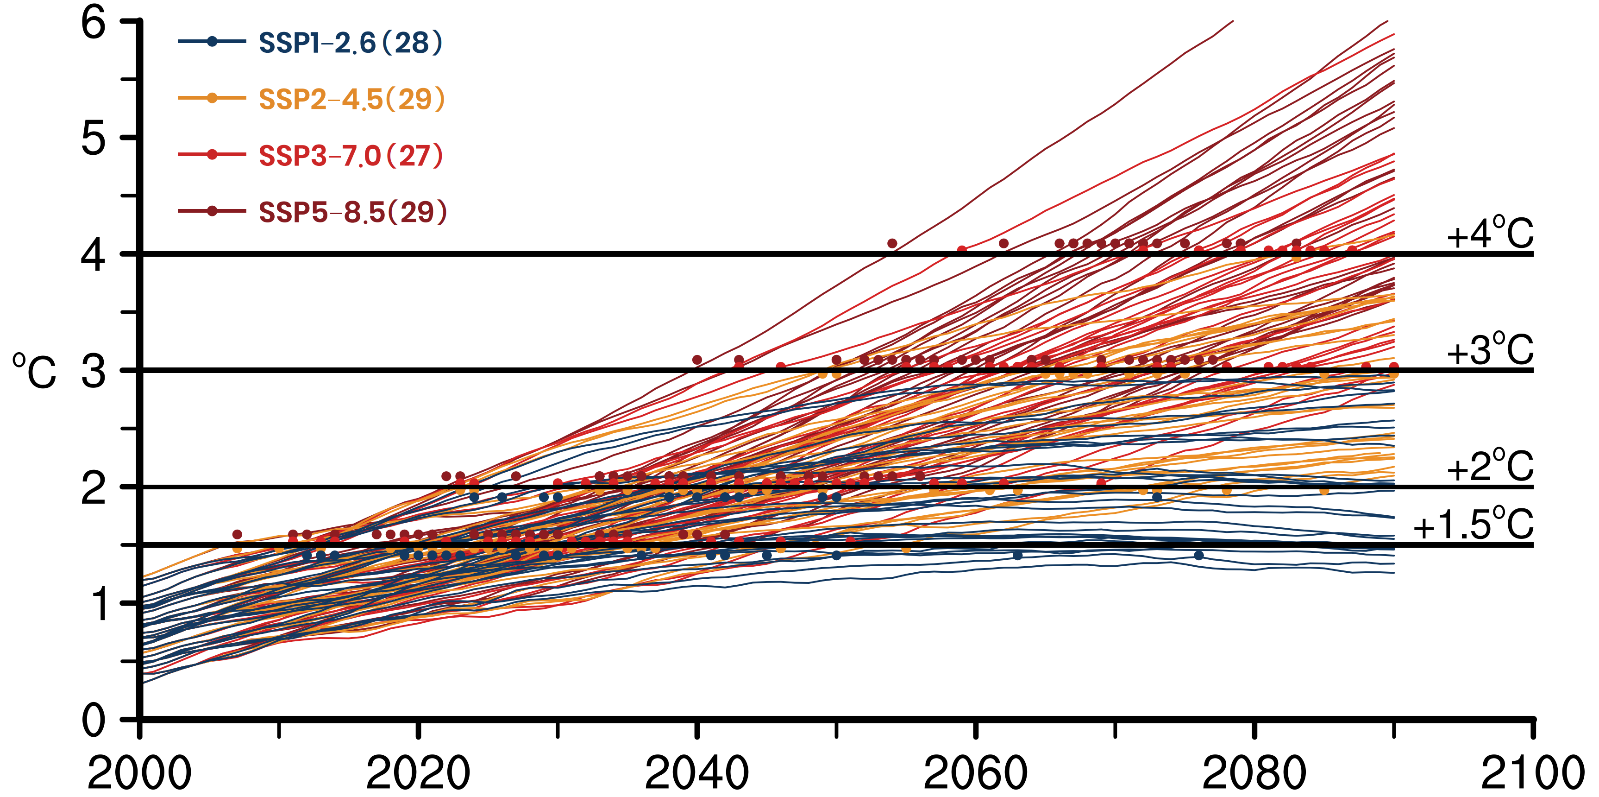
- Global Warming Levels: With reference to the pre-industrial global average temperature (1850-1900), as established by the IPCC, model simulations are used to calculate 20-year periods when global warming first reaches 1.5°C, 2°C, 3°C, and 4°C under different SSP emission scenarios, as shown in Figure 1. (Note: The global average temperature changes simulated by the models are first calculated as 20-year averages to determine whether it exceed specific warming thresholds, rather than relying on annual temperature changes for assessment.)
| Emission Scenario | Explanation |
|---|---|
| SSP5-8.5 | Very high GHG emissions, with CO2 emissions doubling around 2050. |
| SSP3-7.0 | High GHG emissions, with CO2 emissions doubling around 2100. |
| SSP2-4.5 | Medium GHG emissions, with CO2 emissions starting to decline only by the mid-century and not achieving net-zero emissions before 2100. |
| SSP1-2.6 | Low GHG emissions, with CO2 reaching net-zero emissions around 2075. |
Baseline Period and Future Periods
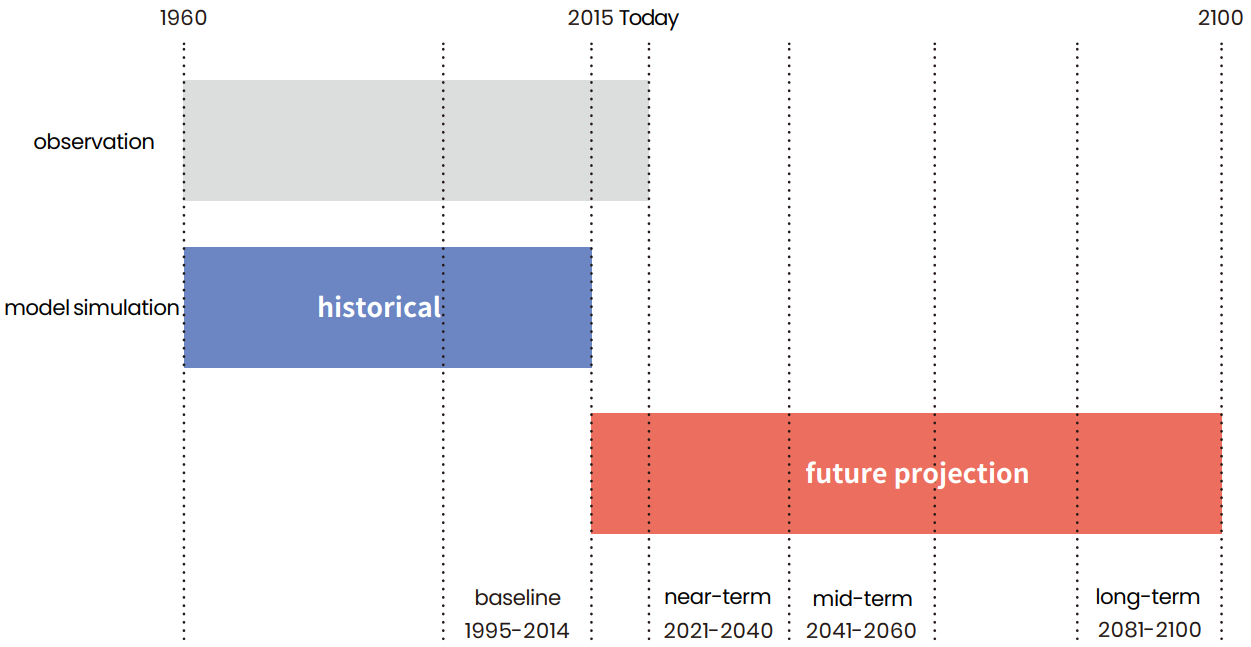
In order to understand the changes in future climate projection relative to the past under different emission scenarios, all models need to compare against the same historical period, referred to as the "baseline period." Similarly, observational data needs to select the same time period as a reference to understand the actual climate conditions during the base period. According to the reference period used in IPCC AR6, the baseline period is defined as 1995-2014, and the future periods are divided into near-term (2021-2040), med-term (2041-2060), and long-term (2081-2100) (see Figure 2). Both the baseline period and future periods use 20-year climate averages.
Baseline Period: 1995-2014
Future Periods: Near-term (2021-2040), Mid-term (2041-2060), Long-term (2081-2100)
Area
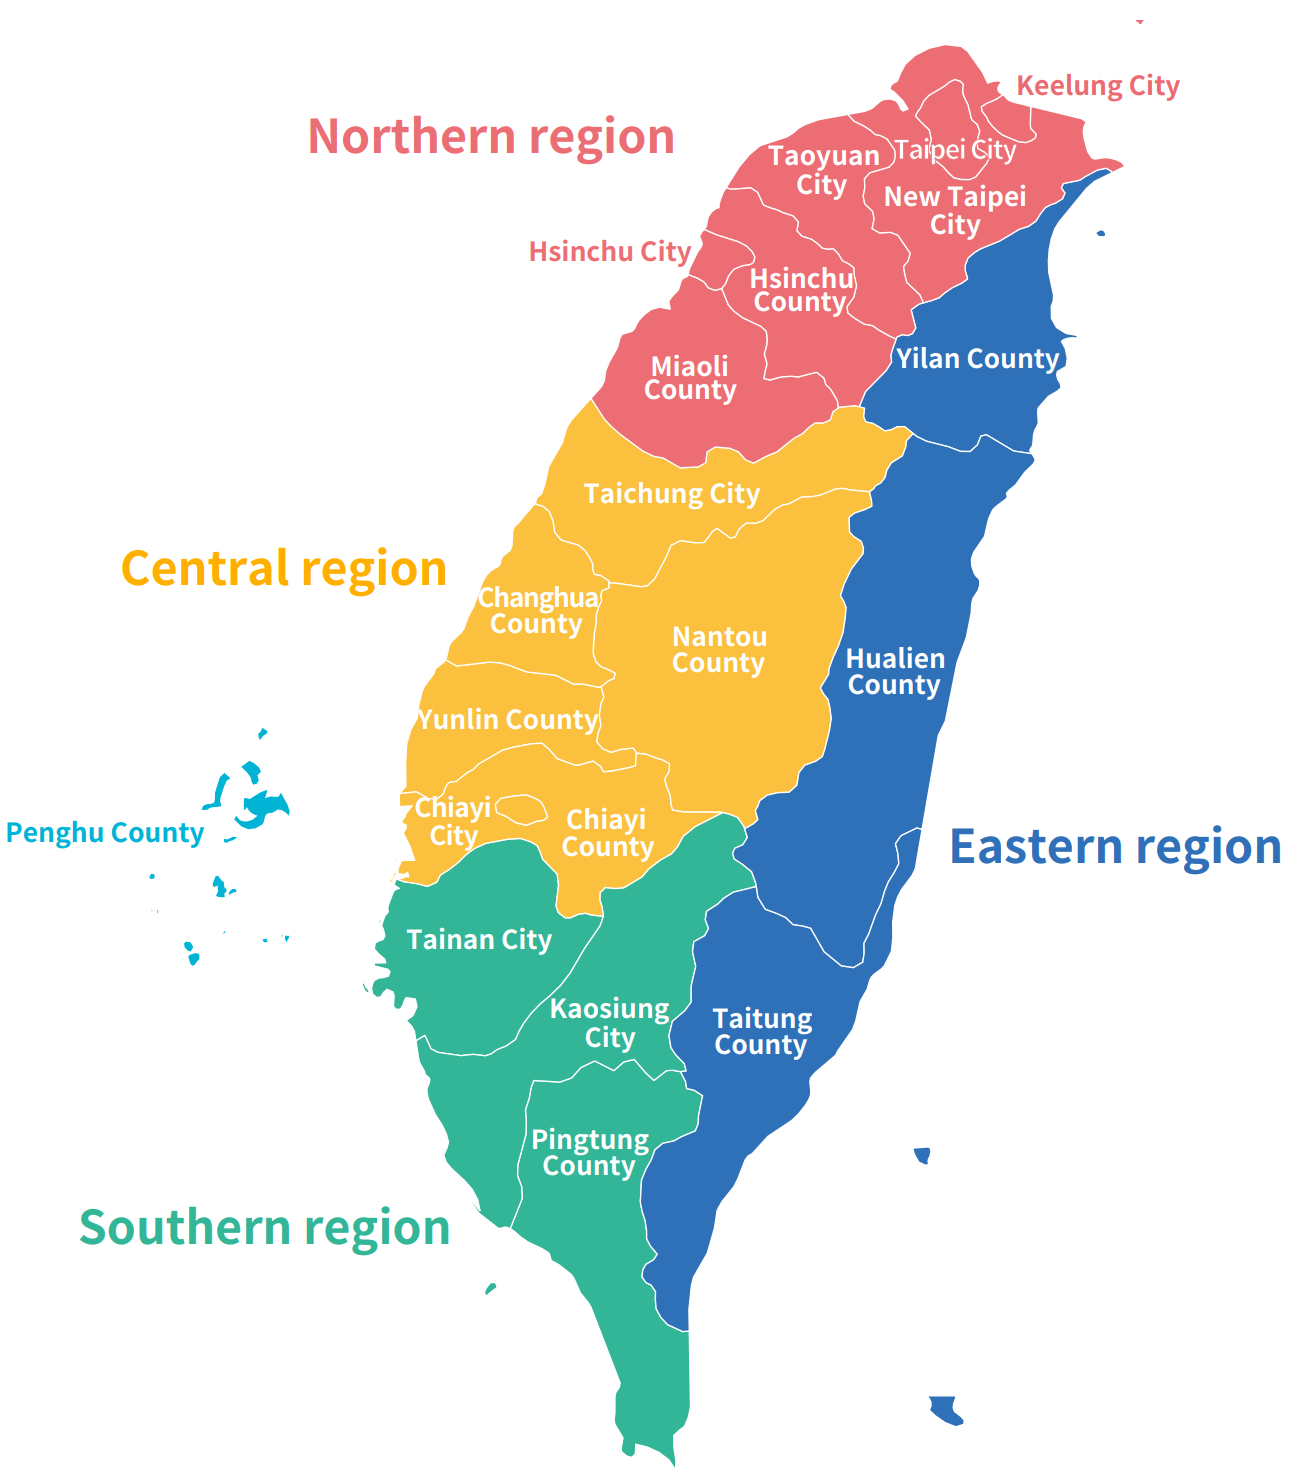
The atlas provides climate change projection information for Taiwan, four regions, and 20 cities and counties. Referring to the regional divisions by the Central Weather Administration, Taiwan Island (including its affiliated islands) is divided into four major regions: Northern, Central, Southern, and Eastern regions. The Northern region includes Keelung City, Taipei City, New Taipei City, Taoyuan City, Hsinchu County, Hsinchu City, and Miaoli County. The Central region includes Taichung City, Changhua County, Nantou County, Yunlin County, Chiayi County, and Chiayi City. The Southern region includes Tainan City, Kaohsiung City, and Pingtung County. The Eastern region includes Yilan County, Taitung County, and Hualien County. Currently, Penghu County is the only outlying island included, while projection information for Kinmen County and Lienchiang County is temporarily unavailable, as shown in Figure 3.
Uncertainty Assessment
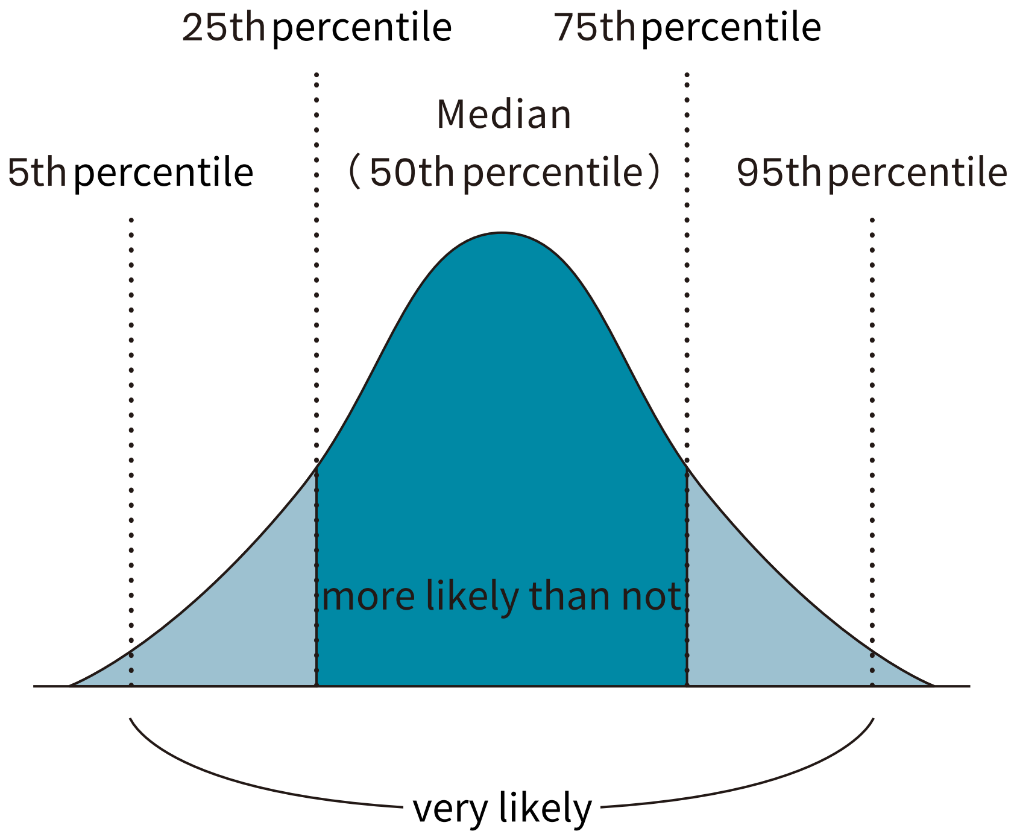
The assessment of uncertainty is quantified using the likelihood definition provided by the IPCC, which utilizes probability distributions from models. The 25th-75th percentile range (representing the 50% probability distribution) is used to represent the ′more likely than not′ range, while the 5th-95th percentile range (representing the 90% probability distribution) is used to represent the ′very likely′ range (as shown in Figure 4).
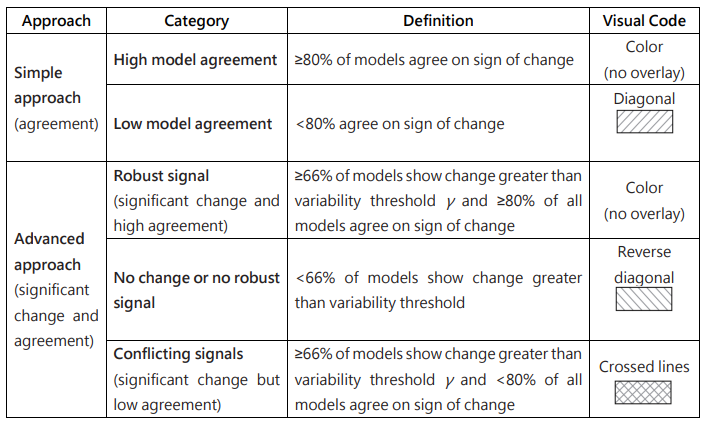
Referring to the robustness assessment of climate change signals in the IPCC AR6 Atlas, two alternative approaches are provided (as shown in Table 4):
- Simple method: Based on the consistency of the sign of change (+ for increase or - for decrease) projected by the models, if at least 80% of the models agree on sign of change, it indicates high model agreement. If less than 80% of the models agree on sign of change, it indicates low model agreement.
- Advanced approach: In addition to the sign consistency among the models, the significance of the climate change signal is also examined. If the future projected change of a model is greater than the internal variability threshold, it is considered to have a significant change. If at least 66% of the models show significant changes and at least 80% of the models agree on the sign of change (i.e., high model agreement), it indicates a robust signal. If less than 66% of the models show significant changes, it indicates no change or no robust signal. If more than 66% of the models show significant changes, but less than 80% of the models agree on the sign of change (i.e., low model agreement), it is considered conflicting signals.
Data Processing Flow:
- Baseline and Future Projection Data: The gridded daily data for the baseline period of 1995-2014 is extracted from observation and model historical simulations . Similarly, the gridded daily data for the future projections in different SSP emission scenarios from 2015 to 2100 is extracted. The variables used depend on the climate change indices, including daily maximum temperature, daily minimum temperature, and daily precipitation.
- Indices Calculation: Calculate the annual values of climate change indices for each grid cell using the baseline (1995-2014) and future projection data (2015-2100).
- Regional Average: To obtain regional information, the climate change indices of all grids within the region are averaged. For example, if there are 22 grids in Taipei City, the climate change indices values of all grids are calculated to derive a regional average. However, if the purpose is to present the spatial map of the baseline or projection (i.e., the values for each grid), this calculation is not necessary.
- Climate Average: Calculate the 20-year average values for the baseline period as a reference, as well as for different future periods (including short-term, medium-term, long-term, or different levels of global warming). Additionally, to show the continuous change of indices over time, a 20-year moving average calculation is applied to obtain the time series of future projections.
- Climate Change Signal: The climate change signal is obtained by subtracting the climate average of the baseline period from the future projection of the climate change indices. If calculating the rate of change (i.e., the percentage change relative to the baseline), divide the change value by the climate average of the baseline period and multiply by 100%. In this atlas, only the precipitation indices, including annual maximum 1-day precipitation (Rx1day), annual maximum consecutive 5-day precipitation (Rx5day), annual total precipitation in wet days (PRCPTOT), and simple daily precipitation intense index (SDII),which units related to the amount of precipitation are presented using the rate of change . Other indices are presented using the change value.
- Change= Future projection - Baseline climatology
- Rate of change= (Change / Baseline climatology) * 100%
- Ensemble Statistics: Each SSP emission scenario or GWLs has a different number of model simulations, referred to as a multi-model ensemble (MME). For the climate change signals projected from the MME, it is common to calculate the average of all models, known as the ensemble mean, or calculate the median of all models, known as the ensemble median. The ensemble mean or median is widely used as the best estimate for climate model simulations.
- Uncertainty Assessment:
- Robustness: For each grid cell, the robustness of the climate change signal is assessed by examining the proportion of models showing an increasing trend (positive sign) or a decreasing trend (negative sign). If at least 80%of the models agree on the sign of change with the ensemble mean, it is considered high model agreement; otherwise, it is considered low model agreement.
- Likelihood Ranges: Calculate various percentiles for the climate change signals projected by the multi-model ensemble , including the 25th-75th percentile and the 5th-95th percentile, to represent the probability ranges of model projections.