Data Service / Atlas of Taiwan Climate Change Key Indices

Atlas of Taiwan Climate Change Key Indices: Hydrological Indices
The Atlas of Taiwan Climate Change Key Indices: Hydrological Indices focuses on the hydrological applications of climate change. Based on the needs expressed by users in the hydrological field, it establishes key assessment indices for various extreme climate. According to the different emission scenarios defined by the Intergovernmental Panel on Climate Change (IPCC) AR5, the statistical downscaling daily data is used to calculate the relevant indices in the atlas. The atlas presents tables and graphs, such as maps, time series, and boxplots, for three different spatial units, including Taiwan, four regions, and the county and city levels.
Data Source and Processing
(I) Gridded Observational Daily Data
The data source and description can be found on the TCCIP website, under “Data Service -> Data Store -> Gridded Observational Daily Data”.
(II) The Taiwan Climate Simulation and Projection Data
The data utilize the climate model data from the Coupled Model Intercomparison Project Phase 5 (CMIP5), contribute to assessments and reports from the Intergovernmental Panel on Climate Change (IPCC). The global climate model output is downscaled to the grid resolution of the Taiwan region using statistical downscaling methods. The downscaled model outputs are then used for calculations and subsequent analyses, considering the multi-model ensemble for each scenario experiment. The downscaling methods can be referenced in the TCCIP website's Newsletter No. 028, and the data sources and descriptions can be found in the TCCIP website under “Data Service -> Data Store -> AR5 Statistical Downscaling Data”. For the list of models used in the climate simulation and projection data, please refer to the "Frequently Asked Questions (FAQ)" section of this document.
Baseline Period and Change Calculation
The Atlas of Taiwan Climate Change Key Indices: Hydrological Indices uses the baseline period 1976-2005, while the projections for future climate change are divided into two periods: mid-21st century (2036-2065) and the end of the century (2071-2100). The change calculation involves subtracting the average value of hydrological indices calculated for each grid point during the future period from the average value during the baseline period (1976-2005), called the change value. To obtain the rate of change (expressed in %), the value is divided by the average value of the baseline period and multiplied by 100%. Further calculations are then performed to determine the average values of grid points within different regional areas.
Spatial Division
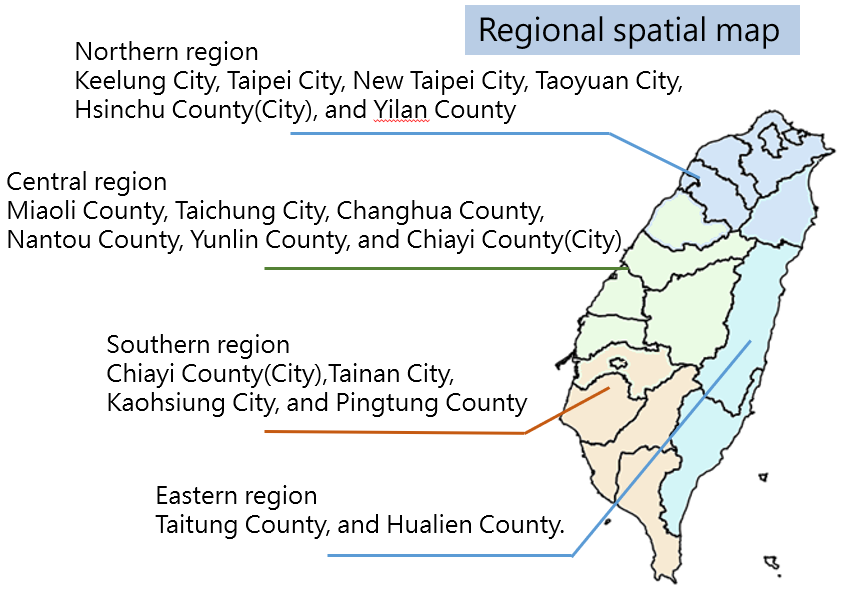
This atlas utilizes different spatial units for division, including Taiwan Island, four regions, and counties/cities. The four regions are divided based on the classification of the Water Resources Agency, which categorizes Taiwan into the Northern, Central, Southern, and Eastern regions (as shown in Figure 1). The Northern region includes Keelung City, Taipei City, New Taipei City, Taoyuan City, Hsinchu County (City), and Yilan County. The Central region includes Miaoli County, Taichung City, Changhua County, Nantou County, and Yunlin County. The Southern region includes Chiayi County (City), Tainan City, Kaohsiung City, and Pingtung County. The Eastern region includes Taitung County and Hualien County.