Publishes
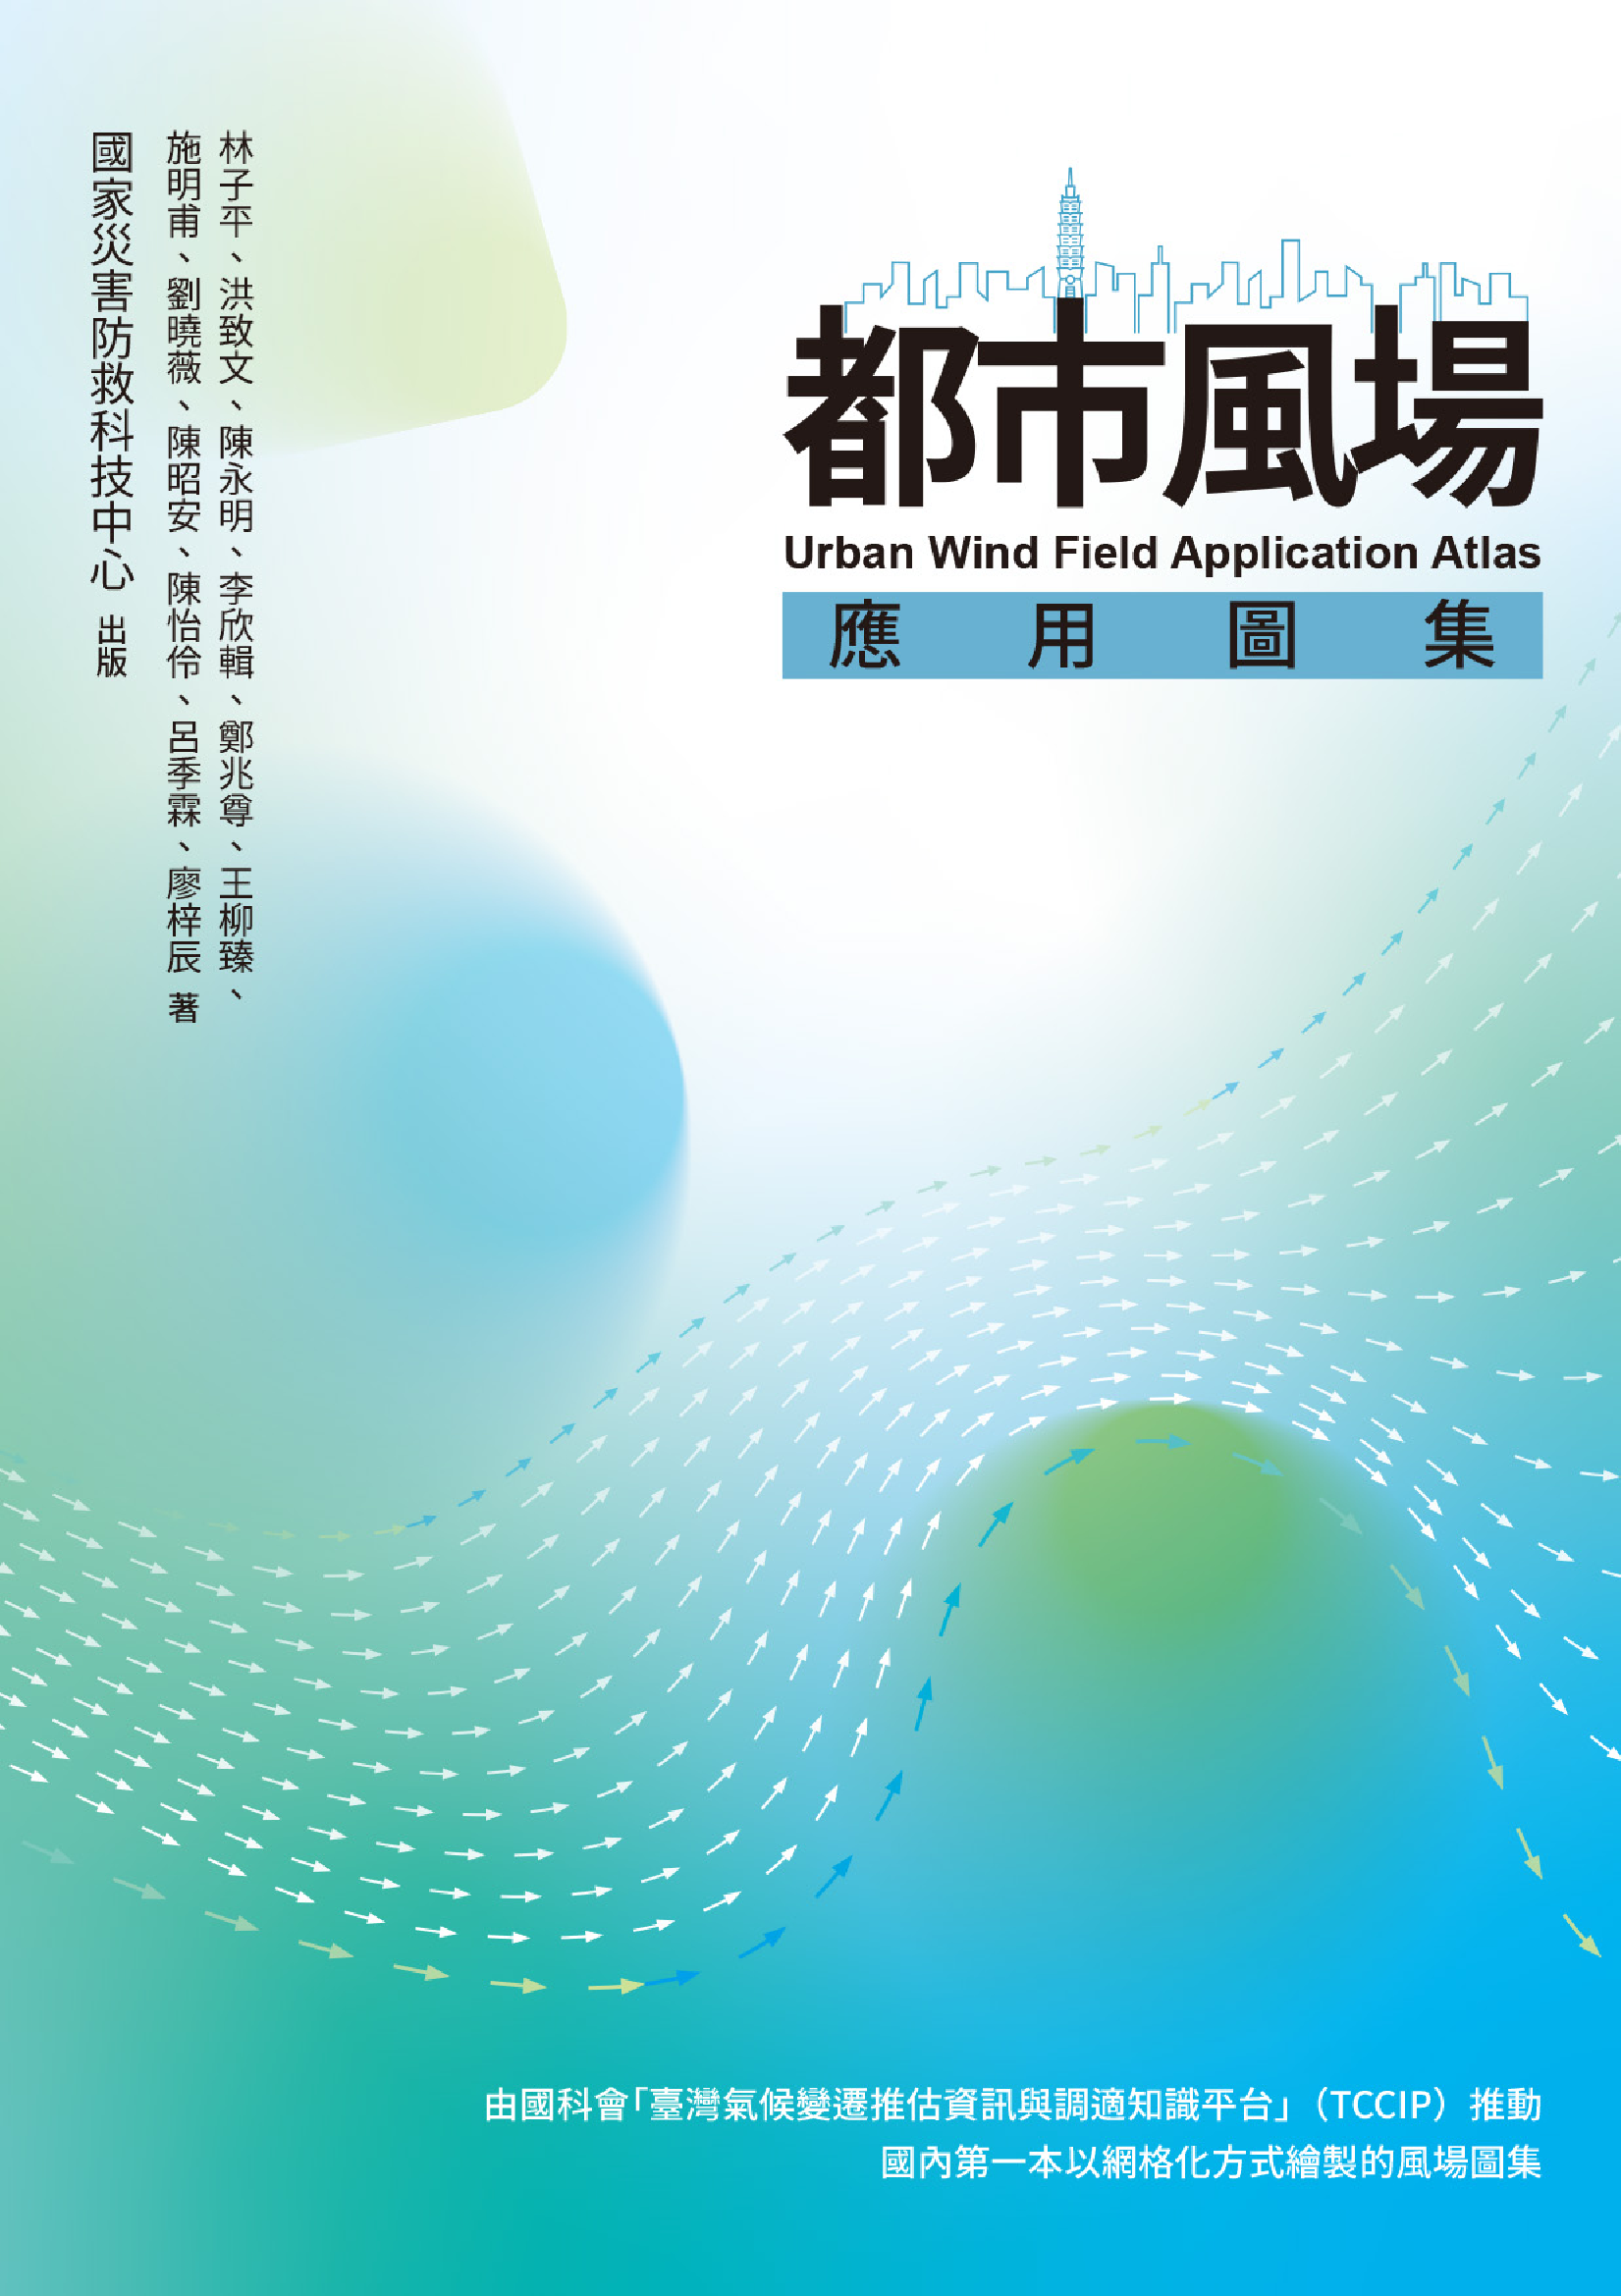
Urban Wind Field Application Atlas
Author : Lin Tzu-Ping, Hung Chih-Wen, Chen Yung-Ming, Li Hsin-Chi, Cheng Chao-Tsun, Wang Liu-Chen, Shih Ming-Fu, Liu Hsiao-Wei, Chen Chao-An, Chen Yi-Ling, Lu Chi-Lin, Liao Tzu-Chen
A well-ventilated environment can effectively mitigate the heat island effect, and making good use of natural ventilation corridors can significantly enhance living comfort. The first domestically produced wind field atlas drawn using a gridded approach, "Urban Wind Field Application Atlas," was jointly completed by the TCCIP Project team, including the research group of Professor Hung Chih-Wen from the Department of Geography, National Taiwan Normal University, the research group of Professor Lin Tzu-Ping from the Department of Architecture, National Cheng Kung University, and the National Science and Technology Center for Disaster Reduction. Using Taiwan ReAnalysis Downscaling Data (TReAD) produced by the TCCIP Project, the atlas presents streamline maps, prevailing wind direction maps, primary and secondary wind direction maps, and wind speed maps at different spatial scales, including the entire island of Taiwan, four major regions, and individual cities and counties, providing reference applications for users with different needs such as urban planning, community development, and architectural design.

2025 Taiwan Climate Change Analysis Series Report: Extreme Rainfall and Impacts in Taiwan under Warming Trends
Author : Hsu Huang-Hsiung, Wang Chun-Yu, Shih Tung-Hsin, Chu Fang-Yi, Li Hsin-Chi, Hung Ching-Shan, Hsu Chih-Tsung, Kuo Jui-Ling, Chen Cheng-Ta, Chen Yung-Ming, Chen Chun-Che, Chen Chao-An, Chen Chia-Chi, Chen Chi-Wen, Tseng Hung-Wei, Huang Wen-Ting, Chao Pin-Yu,
"Extreme Rainfall and Impacts in Taiwan under Warming Trends" is the third topic of the Taiwan Climate Change Analysis Series Report, focusing on extreme rainfall. This report compiles historical and documentary records of extreme rainfall from the Japanese colonial period, long-term station observation data from the Central Weather Administration, and gridded rainfall observational data from the TCCIP Project from 1961 to 2023. From the perspectives of extreme rainfall indices, rainfall with different durations, detection of extreme rainfall events, and rainfall intensity for return periods, it presents the climatic spatiotemporal characteristics of extreme rainfall in Taiwan and the large-scale circulation features of related events. Regarding future projections, the integration of statistically downscaling extreme rainfall indicator analyses and dynamically downscaling typhoon event results produced by the TCCIP Project based on CMIP6 climate simulation data used in the IPCC AR6 report indicates that changes in extreme rainfall cause Taiwan to generally exhibit spatiotemporal characteristics of wetter wet regions and wetter wet seasons, and that strong extreme rainfall caused by typhoons affecting Taiwan will occur more frequently in the future. Under warming trends, extreme rainfall events are intensifying and occurring more frequently; as the degree of warming increases, the impacts of flooding and slope related disasters across most regions of Taiwan will increase accordingly. This report further uses slope impacts in the upper reaches of the Xindian River, analyses of different flooding indicators in the Yanshui River, and the impacts of flooding on agriculture in the Yilan region as examples to illustrate disaster impacts resulting from changes in extreme rainfall under climate change, as well as their potential applications and discussions in disaster risk reduction and adaptation.
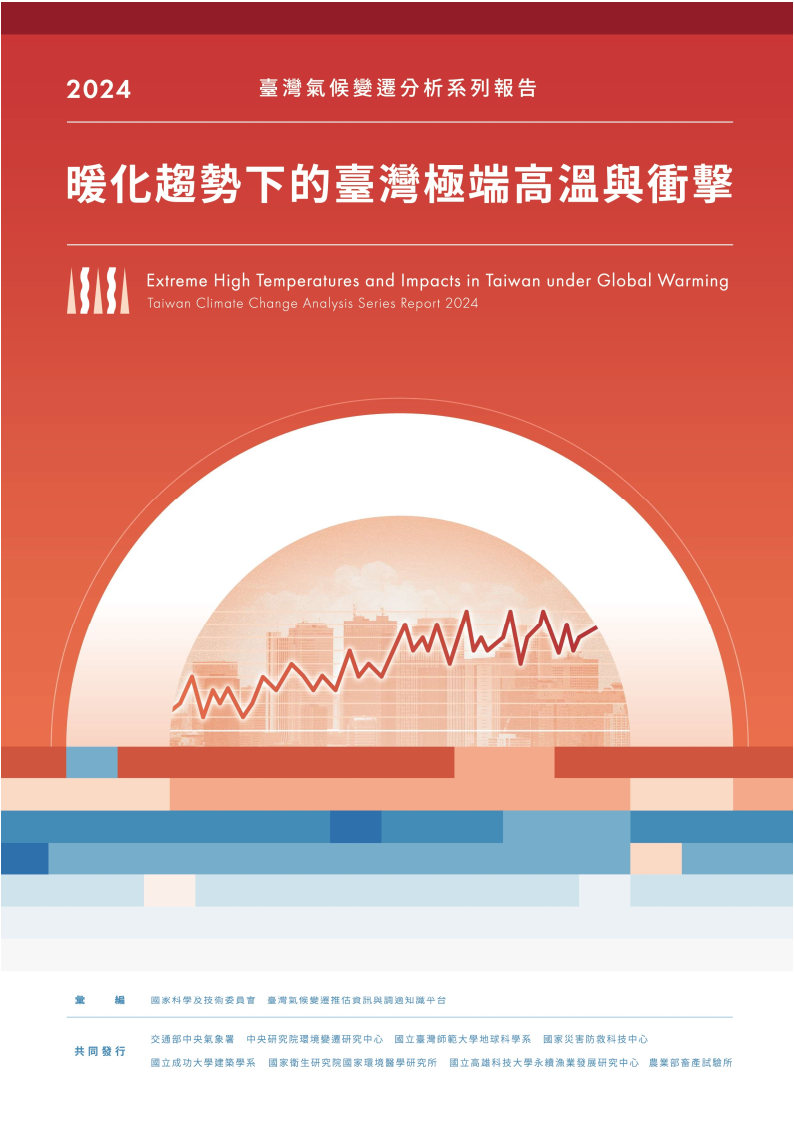
Taiwan Climate Change Analysis Series Report 2024: Extreme High Temperatures and Impacts in Taiwan under Global Warming
Author : Hsu Huang-Hsiung, Wang Chun-Yu, Wang Liu-Chen, Wu Wei-Te, Li Hsin-Chi, Li Ssu-Ying, Li Shih-Yu, Lin Tzu-Ping, Lin Ching-Chun, Tu Po-An, Shih Yi-Min, Hung Jo-Ya, Hung Ching-Shan, Chi Chia-Fa, Chang Ya-Hui, Chen Cheng-Ta, Chen Yung-Ming, Chen Pao-Chung, Che
This report not only summarizes early high-temperature records in Taiwan provided by historical and documentary sources, but it also analyzes the pronounced warming trend in Taiwan based on observational data from 6 century-long stations in Taipei, Taichung, Tainan, Hengchun, Hualien, and Taitung. In addition, the year-by-year changes in annual minimum temperatures at the Alishan Meteorological Station from 1933 to 2023 show that the long-term warming trend has occurred not only in urban areas but also in mountainous regions at elevations above 2,000 meters. Future climate model projections indicate that high temperature indices across all regions of Taiwan will increase as the degree of warming intensifies. Under a warming climate, extreme high temperature events will occur more frequently, exerting varying degrees of impact on daily life in terms of food, clothing, housing, and transportation for those living in Taiwan. Future projections of high temperature indices indicate that a global warming level of 2°C is a critical threshold. To avoid more frequent and extreme high temperature events and impacts resulting from intensified warming, more proactive and effective measures are required to mitigate the warming trend and reduce the impacts of high temperature environments on human health and industries.
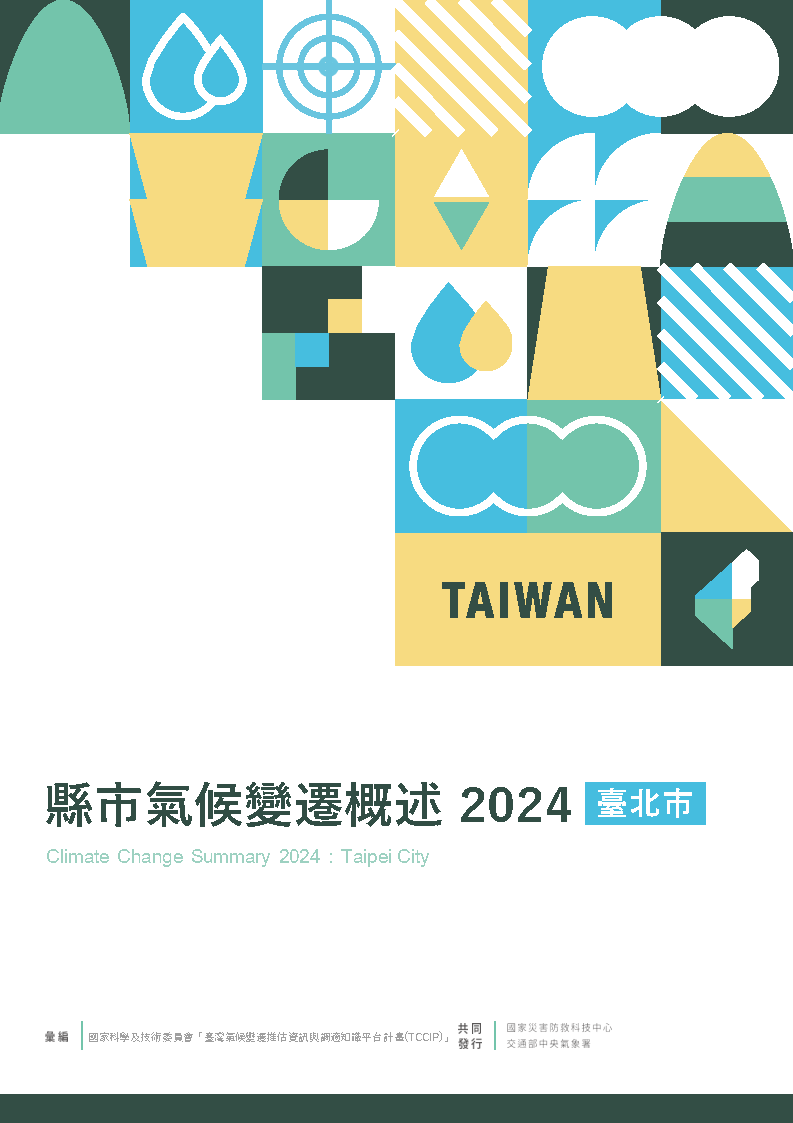
Taiwan Climate Change Summary 2024 Basic Edition
Author : Chen Yung-Ming, Wang Chun-Yu, Li Ting-Hsuan, Li Yen-Wei, Lin Shih-Yao, Chou Chih-Chung, Chen Chao-An, Tung Yu-Hsiang, Chao Pin-Yu, Cheng Chao-Tsun, Liu Hsaio-Wei, Lo Tzu-Ting
"Taiwan Climate Change Summary 2024" uses scientific data and graphical information to concisely describe the past, present, and future climate conditions and trends of a total of 22 counties and cities, including 19 counties and cities on Taiwan’s main island and 3 offshore island counties and cities. "Taiwan Climate Change Summary 2024" provides climate overviews for each county and city based on three different regional classifications: plains below 500 meters in elevation, mountainous areas between 500 and 1,500 meters, and high mountain areas above 1,500 meters. "Taiwan Climate Change Summary 2024" uses gridded observational value-added data produced by the TCCIP Project and station data from the Central Weather Administration to provide past changes and current conditions for counties and cities; future climate projections are based on AR6 statistical downscaling daily data produced by the TCCIP Project. Past changes (1960-2020) present trends in annual average temperature and annual rainfall for individual counties and cities; charts are used to show current conditions (1991-2020) of annual average maximum temperature, average temperature, minimum temperature, and rainfall for each county or city; future climate changes for each county or city are projected using indicators such as annual average temperature, annual number of days with high temperatures of 36°C, annual rainfall, seasonal rainfall, annual maximum one-day rainfall, and annual longest consecutive dry days. Readers may download the e-book from Knowledge Services/Publications.
Taiwan Climate Change Summary 2024 - Multi-scenario and Model Uncertainty Assessment
Author : Chen Yung-Ming, Wang Chun-Yu, Li Yen-Wei, Lin Shih-Yao, Chou Chih-Chung, Chen Chao-An, Tung Yu-Hsiang, Chao Pin-Yu, Cheng Chao-Tsun, Liu Hsaio-Wei, Lo Tzu-Ting
The "Taiwan Climate Change Projection Information and Adaptation Knowledge Platform Project" (abbreviated as TCCIP), promoted by the National Science and Technology Council has long engaged in the production and application promotion of localized climate change data. In September 2024, in collaboration with the Central Weather Administration under the Ministry of Transportation and Communications, it published the "County / City Climate Change Overview 2024" (abbreviated as Climate Overview). Targeting all 22 counties and cities nationwide, the publication organizes meteorological scientific data and produces graphical information to provide a concise description of climate information for each county or city, enabling users to quickly grasp the past, present, and future climate conditions and trends of that county or city. To ensure a more comprehensive presentation of scientific data, this publication was again produced in collaboration with the Central Weather Administration as "Taiwan Climate Change Summary 2024 - Multi-Scenario and Model Uncertainty Assessment." In addition to providing information on global warming levels, it also includes four sets of different warming scenarios and model uncertainty assessments with statistical testing, serving as a reference for users who have read the Climate Overview and wish to further understand more complete climate information. The information provided in this Climate Overview includes past climate changes at the county and city level, current climate conditions, and future projection information. It also explains the data used in the overview, the division of time periods and regions, climate change scenario settings, climate change indicators, and the possible ranges and uncertainties of model projections.
Taiwan Climate Change Key Indicator Atlas: AR6 Statistical Downscaling Edition
Author : Compiled by the National Science and Technology Council “Taiwan Climate Change Projection Information and Adaptation Knowledge Platform, TCCIP”
In 2019, the TCCIP project team used CMIP5 climate model data adopted by IPCC AR5 and produced statistically downscaling gridded data with a spatial resolution of 5km by 5km to compile the "Taiwan Climate Change Key Indicator Atlas. " In 2023, the TCCIP project team used CMIP6 climate model data adopted by IPCC AR6 and produced statistically downscaled gridded data with a resolution of 0.05 degrees by 0.05 degrees in latitude and longitude to compile the "Taiwan Climate Change Key Indicator Atlas: AR6 Statistical Downscaling Edition. " Using the latest climate projection data, this atlas provides projection information for 11 temperature indicators and 11 rainfall indicators for Taiwan as a whole and for each county and city. It includes projection results under SSP RCP emission scenarios that combine the Shared Socioeconomic Pathways and Representative Concentration Pathways in IPCC AR6, as well as the Global Warming Levels projections proposed by the IPCC in recent years. This enables the public to more easily understand and compare future climate change conditions as the global average temperature rises to different levels. In addition, this atlas uses multi model projection results and presents model probability distributions (ranges of likelihood) using different percentile intervals. It also represents uncertainties in climate projections with different symbols based on the consistency and significance among model projection results (robustness assessment). First-time users of the "Taiwan Climate Change Key Indicator Atlas: AR6 Statistical Downscaling Edition" are advised to read "About the Atlas" and "Atlas Guide" first in order to understand the legends used in the atlas.
Taiwan Climate Change Analysis Series Report 2023: Record-breaking Drought 2020-2021 and Future Projection of Drought Events in Taiwan
Author : Chen Chao-An, Li Ming-Ying, Liu Tzu-Ming, Hsu Huang-Hsiung, Lo Tzu-Ting, Chen Yung-Ming, Tung Yu-Hsiang, Wu Chien-Ying, Hung Hao-Che, Cheng Chao-Tsun, Lin Ssu-Ying.
This report uses historical records and long-term observational data, combined with scientific mechanisms, to examine the causes of extreme drought events. It further draws on the latest model projection data and presents, across five chapters, the TCCIP project team’s analysis of past, present, and future drought events in Taiwan. Chapter 1 reviews early meteorological drought events in Taiwan based on historical records preserved by the Central Weather Administration. Chapter 2 examines meteorological droughts in Taiwan using TCCIP observational gridded data. Chapter 3 focuses on the severe nationwide drought event of 2020-2021 and explores the possible mechanisms behind its occurrence. Building on the analyses of Taiwan’s meteorological drought characteristics in the first three chapters, Chapter 4 further examines future seasonal rainfall changes in Taiwan using TCCIP statistical downscaling data and projects the conditions of meteorological drought events. Chapter 5 presents the rates of change in streamflow across 20 river basins within four major water resource regions under different seasons in order to assess the impacts of climate change induced seasonal rainfall changes on Taiwan’s water resources.
Taiwan Climate Change Key Indicator Atlas - Hydrological Application Indicators
Author : Compiled by the National Science and Technology Center for Disaster Reduction, National Science and Technology Council “Taiwan Climate Change Projection Information and Adaptation Knowledge Platform, TCCIP”
The "Taiwan Climate Change Key Indicator Atlas - Hydrological Application Indicators" focuses on hydrological applications of climate change. Based on the needs proposed by users in the hydrological field, it establishes key assessment indicators for various extreme climate events and uses statistically downscaled daily data to calculate the relevant indicators. According to different warming scenarios defined by the Intergovernmental Panel on Climate Change (IPCC), charts are produced for three different spatial units, namely, nationwide, four major hydrological application regions, and counties and cities, and are ultimately compiled into a volume.
Atlas of Key Climate Change Indicators in Taiwan
Author : Compiled by the National Science and Technology Center for Disaster Reduction, National Science and Technology Council “Taiwan Climate Change Projection Information and Adaptation Knowledge Platform, TCCIP”
The “Atlas of Key Climate Change Indicators in Taiwan” aims to transform the abundant and complex foundational climate change datasets and computational results from the past into key climate change indicators, serving as reference data for understanding climate change trends in Taiwan. These key indicators were developed by the TCCIP project in accordance with the Climate Change Detection and Indices (CCDI) recommended by the World Meteorological Organization (WMO). They include key assessment items for extreme climate events of particular concern to us, such as extreme high temperatures, extreme low temperatures, heavy rainfall, and droughts. This atlas compiles the key assessment items for the aforementioned extreme climate events into climate change key indicators under different warming scenarios defined by the IPCC, across different spatial units, including nationwide, four major regions, and individual counties and cities. These indicators are then transformed into charts and compiled into a volume to form the atlas. It is hoped that readers can, through this "Taiwan Climate Change Key Indicator Atlas," quickly access and understand the various projected information related to Taiwan’s future climate change.
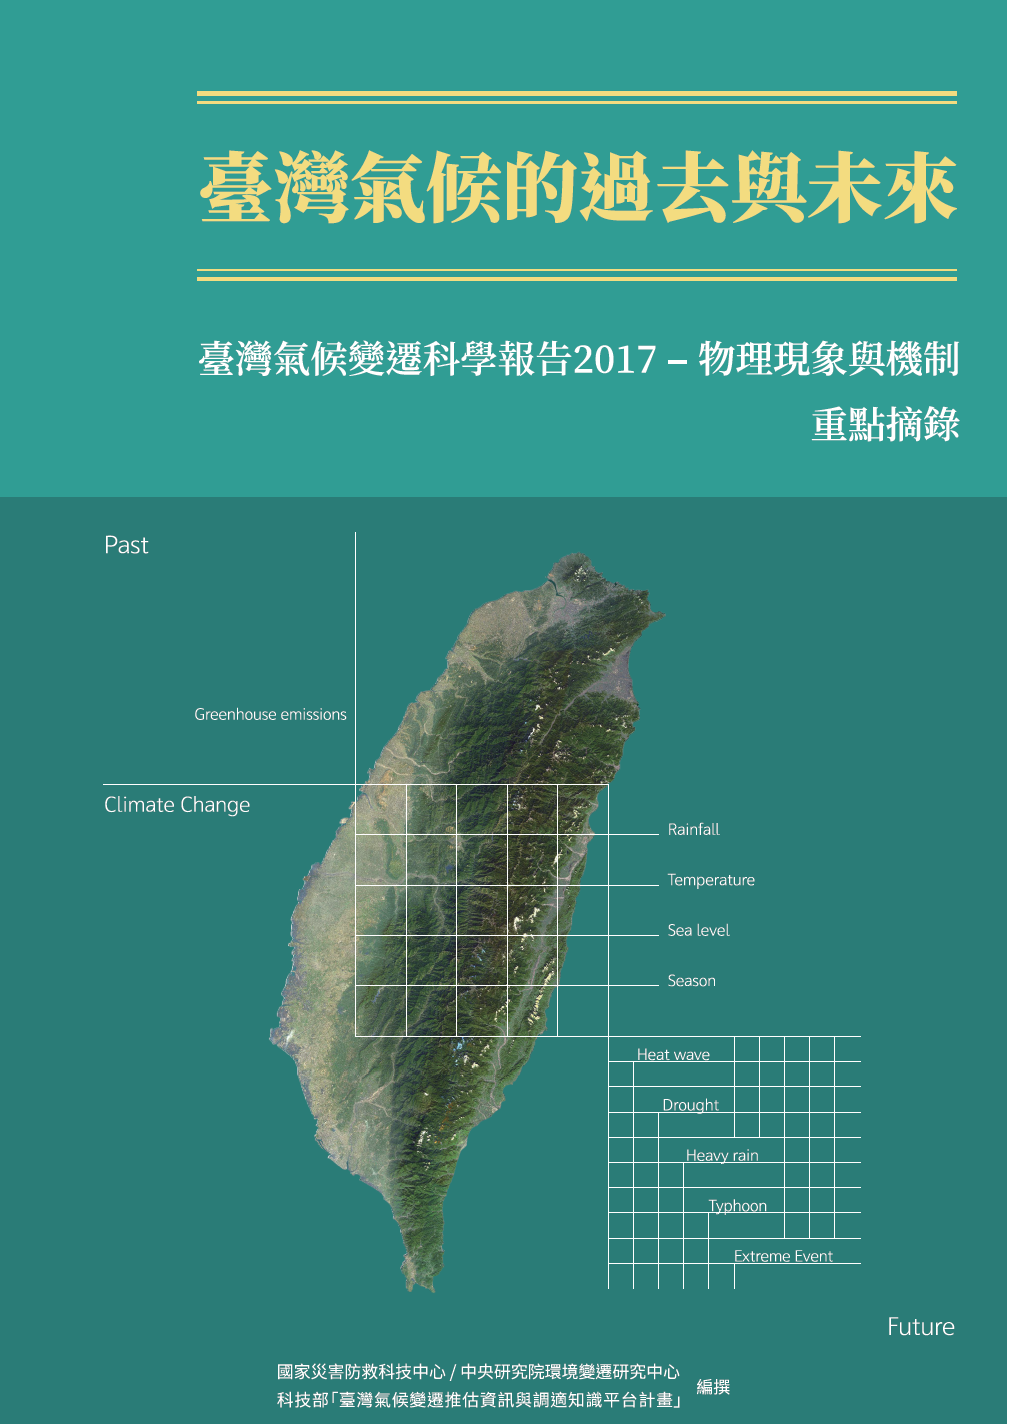
Taiwan’s Past and Future Climate
Author : Compiled by the National Science and Technology Center for Disaster Reduction, the Research Center for Environmental Changes of Academia Sinica, and the National Science and Technology Council
“Taiwan Climate Change Projection Information and Adaptation Knowledge Platform, TCCIP” "Taiwan’s Past and Future Climate" organizes seven key findings from the "Taiwan Climate Change Science Report 2017 - Physical Phenomena and Mechanisms," as well as ten important questions that readers may be concerned about, enabling readers to quickly grasp the content of the scientific report. As the scientific content of this report is primarily derived from the "Taiwan Climate Change Science Report 2017 - Physical Phenomena and Mechanisms," relevant details can be traced back to the scientific report for more detailed analyses and content. We hope that through this “bridge book,” readers can further grasp the climate change information diligently compiled by scientific researchers. We also expect that this report will be helpful to the public, students, researchers, and government agencies in Taiwan who are concerned about understanding climate change science, as well as the related research and policy implementation efforts.
Taiwan Climate Change Science Report 2017 Vol. II Impacts and Adaptation Perspectives (Executive Summary)
Author : Li Ming-Hsu, Lu Hu-Sheng, Su Hui-Chen, Chang Ching-Chen, Chan Shih-Liang, Hsu Tai-Wen, Li He-Ching.
"Taiwan Climate Change Science Report 2017 - Impacts and Adaptation Perspectives (Executive Summary)" presents concise text and graphics summarizing the impacts of climate change on issues such as disasters, ecosystems, water resources, food production and security, human health, socioeconomics, and spatial development in Taiwan, as well as possible adaptation measures. For the complete discussion, please refer to the "Taiwan Climate Change Science Report 2017 - Impacts and Adaptation Perspectives."
Taiwan Climate Change Science Report 2017 Vol. I Physical Phenomena and Mechanisms (Executive Summary)
Author : Chou Chia, Li Ming-An, Hsu Huang-Hsiung, Hung Chih-Cheng, Lu Meng-Ming, Chen Cheng-Ta.
"Taiwan Climate Change Science Report 2017 - Physical Phenomena and Mechanisms (Executive Summary)" presents concise text and graphics summarizing the key points of each chapter, enabling readers to quickly understand the overview of the scientific report. For the physical phenomena and mechanisms of climate change trends globally, in East Asia, and in Taiwan, please refer to the "Taiwan Climate Change Science Report 2017 - Physical Phenomena and Mechanisms."
Taiwan Climate Change Science Report 2017 Vol. II Impacts and Adaptation Perspectives (Full Version)
Author : Tung Ching-Pin, National Science and Technology Center for Disaster Reduction, Li Pei-Fen, Lin Hsing-Chu, Li Ming-Hsu, Lu Hu-Sheng, Su Hui-Chen, Chang Ching-Chen, Chan Shih-Liang, Hsu Tai-Wen, Li He-Ching.
"Taiwan Climate Change Science Report 2017" is published in two volumes, providing scientific analyses of different aspects of climate change, including physical phenomena and mechanisms, as well as impacts and adaptation. Vol. II consists of eleven chapters and primarily focuses on domestic scientific research outcomes. It analyzes and synthesizes the potential impacts of climate change and possible adaptation actions, and discusses the impacts of climate change on issues in Taiwan such as disasters, ecosystems, water resources, food production and security, human health, socioeconomics, and spatial development, as well as potential adaptation measures.
Taiwan Climate Change Science Report 2017 Vol. I Physical Phenomena and Mechanisms (Full Version)
Author : Chou Chia, Li Ming-An, Hsu Huang-Hsiung, Hung Chih-Cheng, Lu Meng-Ming, Chen Cheng-Ta.
"Taiwan Climate Change Science Report 2017" is published in two volumes, providing scientific analyses of different aspects of climate change, including physical phenomena and mechanisms, as well as impacts and adaptation. Vol. I is divided into six chapters, organizing and analyzing climate change trends globally, in East Asia, and in Taiwan, and projecting possible future climate change in Taiwan. Appendices: "Compilation of Taiwan Climate Observation Analysis Results" and "Atlas of Future Taiwan Regional Climate Projection Scenarios."
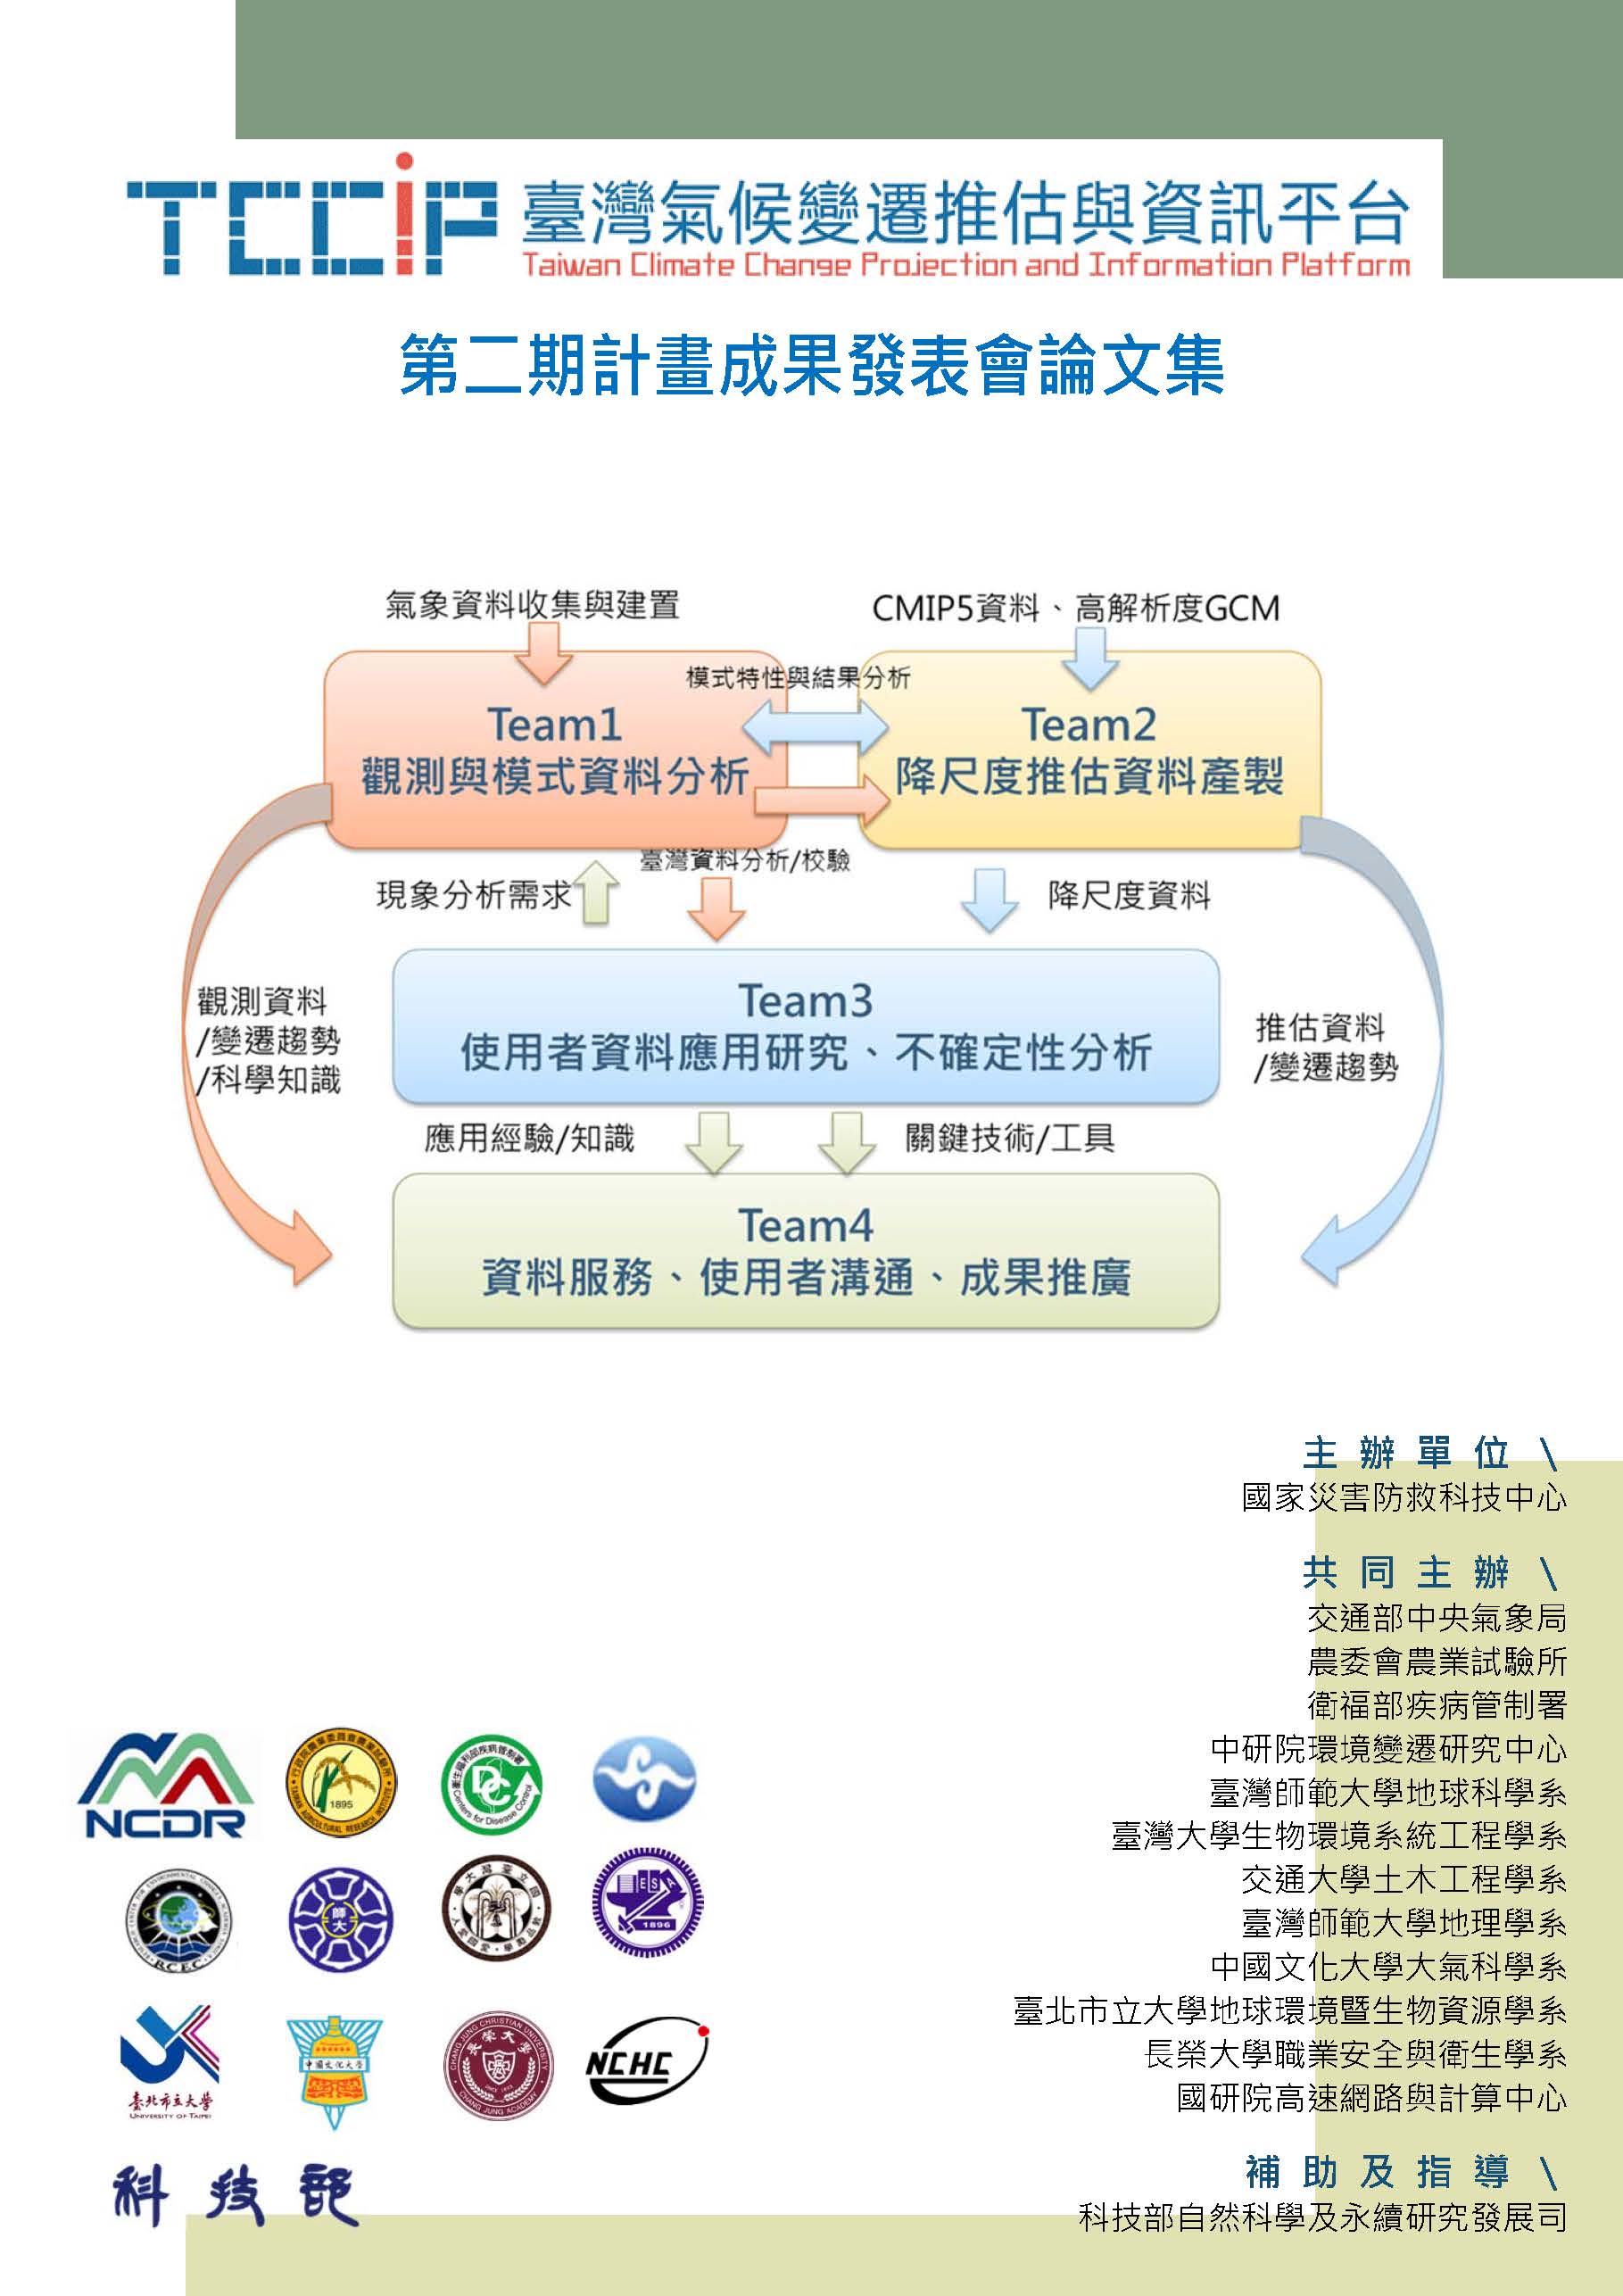
Proceedings of the “Taiwan Climate Change Projection and Information Platform Development” (TCCIP) Results Presentation Conference
Author : Taiwan Climate Change Projection and Information Platform Development Project Team
The “Taiwan Climate Change Projection and Information Platform Development” (TCCIP) project structures climate change data, information, and knowledge services from four aspects, namely, analysis of climate change observations and model data in Taiwan, development of downscaling projection techniques and data production, development of climate data application technologies, and climate data services and application promotion. Since its implementation in November 2009, the TCCIP project has strengthened fundamental scientific research on climate change, enhanced the establishment of climate change data for Taiwan, improved climate change projection capabilities, and developed climate data application technologies and tools, providing more comprehensive climate data services through an information platform. This event plans to invite scholars from technology communities across different fields, policymakers, and relevant practitioners and promoters to jointly understand the methods and achievements of climate change science data production and value addition under the climate change priority programs promoted by the Ministry of Science and Technology in recent years. This volume includes the papers presented at this results presentation conference for external reference.
Climate Change 2013 The Physical Science Basis (Summary for Policymakers)
Author : IPCC Special Report, translated by the National Science and Technology Center for Disaster Reduction
The assessment reports of the IPCC are important reference information for governments worldwide when formulating and promoting relevant policies to address the impacts of future climate change. The IPCC released its Fifth Assessment Report in stages in 2013. The TCCIP project translated the "CLIMATE CHANGE 2013: The Physical Science Basis" Summary for Policymakers, enabling readers to understand the latest scientific analyses and assessments of global and regional climate change.
IPCC Special Report on Extreme Events and Disaster Risk (Summary for Policymakers)
Author : IPCC Special Report, translated by the National Science and Technology Center for Disaster Reduction
The Special Report on Managing the Risks of Extreme Events and Disasters to Advance Climate Change Adaptation (SREX), released by the IPCC in 2012, examines the interactions among climatic, environmental, and human factors from different perspectives of climate science and disaster risk management, and presents integrated insights. The TCCIP project completed the Chinese translation of the SREX (Summary for Policymakers) in 2013, assessing how exposure and vulnerability under extreme events determine potential disaster impacts, and providing decision makers at all levels with guidance for managing disaster risks caused by extreme climate events.
Climate Change in Taiwan: Scientific Report 2011
Author : Hsu, Huang-Hsiung, Chia Chou, Yi-chao Wu, Mong-Ming Lu, Cheng-Ta Chen, Yung-Ming Chen
The Intergovernmental Panel on Climate Change (IPCC) published its fourth Assessment Report (IPCC AR4) in 2007, which discussed climate change in the last 100 years and the possible impact of continuous warming over the next 100 years. The report indicated that, in the last 100 years, global mean surface temperatures have risen by 0.74° C, the rate of warming is accelerating, the sea level has risen, and the frequency and intensity of extreme events such as heat waves, droughts, and heavy rains have increased (IPCC, 2007). The United Nations (UN) has repeatedly called on governments worldwide to reduce greenhouse gas emissions to slow down global warming, to acknowledge the impact of climate change, and to implement adaptation measures. Taiwan is in an area that is at high-risk for natural disasters. The impact of climate change is a major concern to the government and the public. Climate change and homeland security have become critical issues that cannot be ignored.