ARK V3.0 / Customized Portal / Beginner

Beginner
Basic
The integration of the basic concepts, types, and cross-platform resources of climate change adaptation can serve as an introductory reference for quickly understanding climate change adaptation knowledge.
Climate change from a historical data perspective

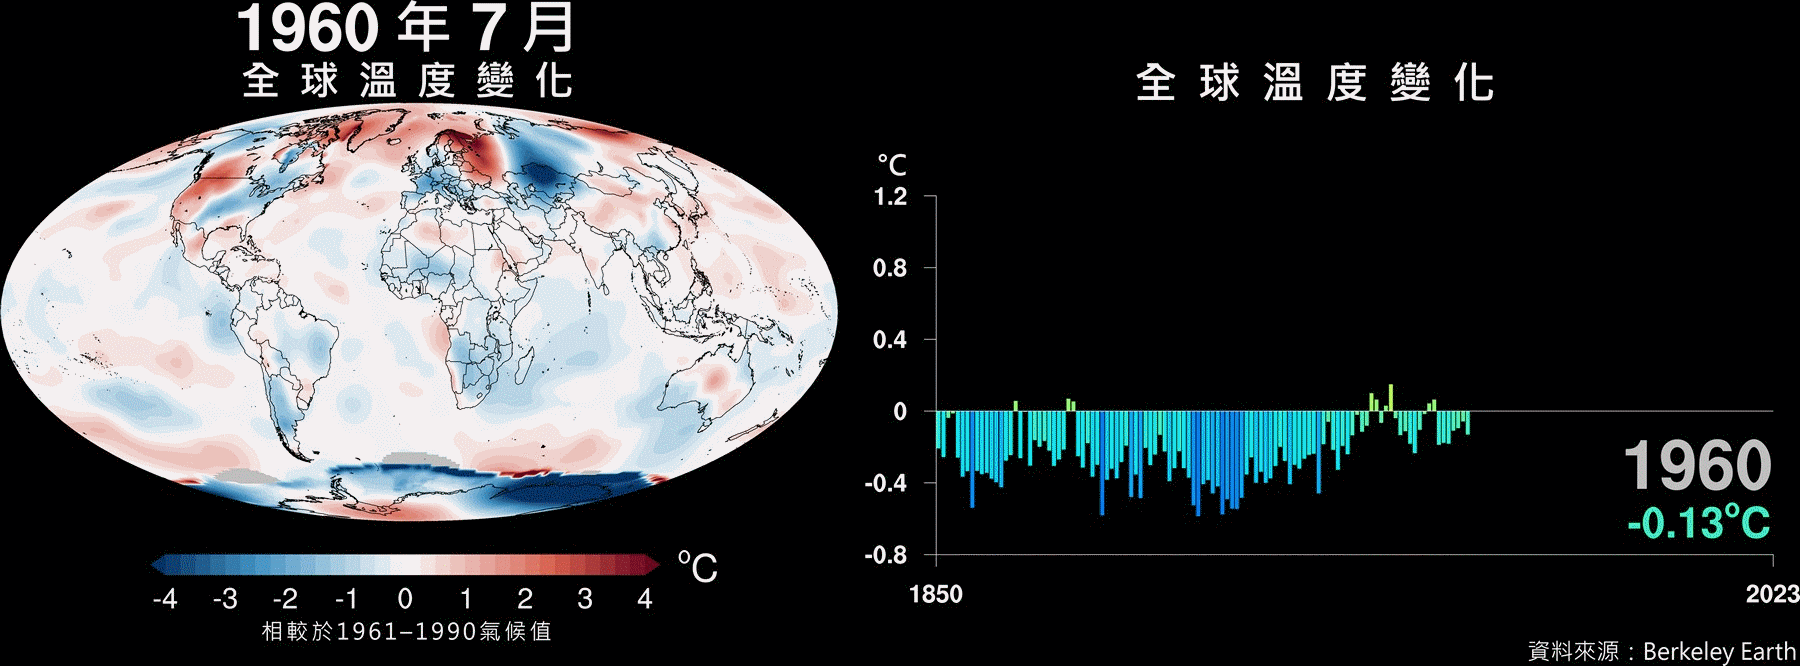
Global temperature change
The global temperature change shown in the figure represents deviations relative to the local climate averages from 1961 to 1990. In the left figure, the red areas in the global spatial distribution expand year by year, indicating that an increasing number of regions are experiencing rising temperatures. The right figure shows that temperature changes since 1850 have shifted from negative to positive values, demonstrating that the trend of global warming has become increasingly evident.
Temperature change in Taiwan
The spatial distribution map on the left shows the climatological average of Taiwan’s annual mean temperature (1961-1990), while the time series on the right indicates that Taiwan’s temperature relative to the average has increased year by year.

Rainfall change in Taiwan
The spatial distribution map on the left shows the climatological average of Taiwan’s annual rainfall (1961-1990). Although the time series of annual average rainfall on the right does not exhibit a significant linear trend over time, the increasing magnitude of fluctuations indicates that both the intensity and frequency of extreme droughts and heavy rainfall events have increased.
